Publish Lists
Publish Lists are lists of tags which are exposed by the device using a "Pub/Sub" (publish and subscribe) protocol. These tags are refreshed periodically throughout the day. Their contained data is sent to the IoT Hub. These tags can then be used by any client. A Publish List can be connected to a Real-time tag or a Historical tag.
To Add a New Publish List:
-
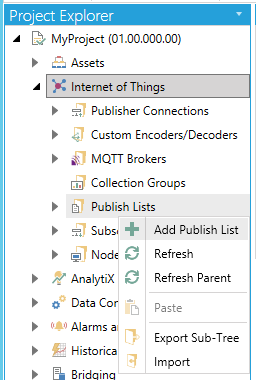
In Workbench, expand a project and then expand the Internet of Things node. Right-click on the Publish Lists node, as shown below, and then select Add Publish List.
Add Publish List from Project Explorer in the Workbench
-OR-
Select Publish Lists then click on the Add Publish List button (shown below) in the Edit section of the Home ribbon in Workbench.
Add Publish List Button

-
This opens the New Publish List properties in the middle of the Workbench shown below. The properties are split between the General and Published Points tabs, described below.
New Publish List Properties - General Tab
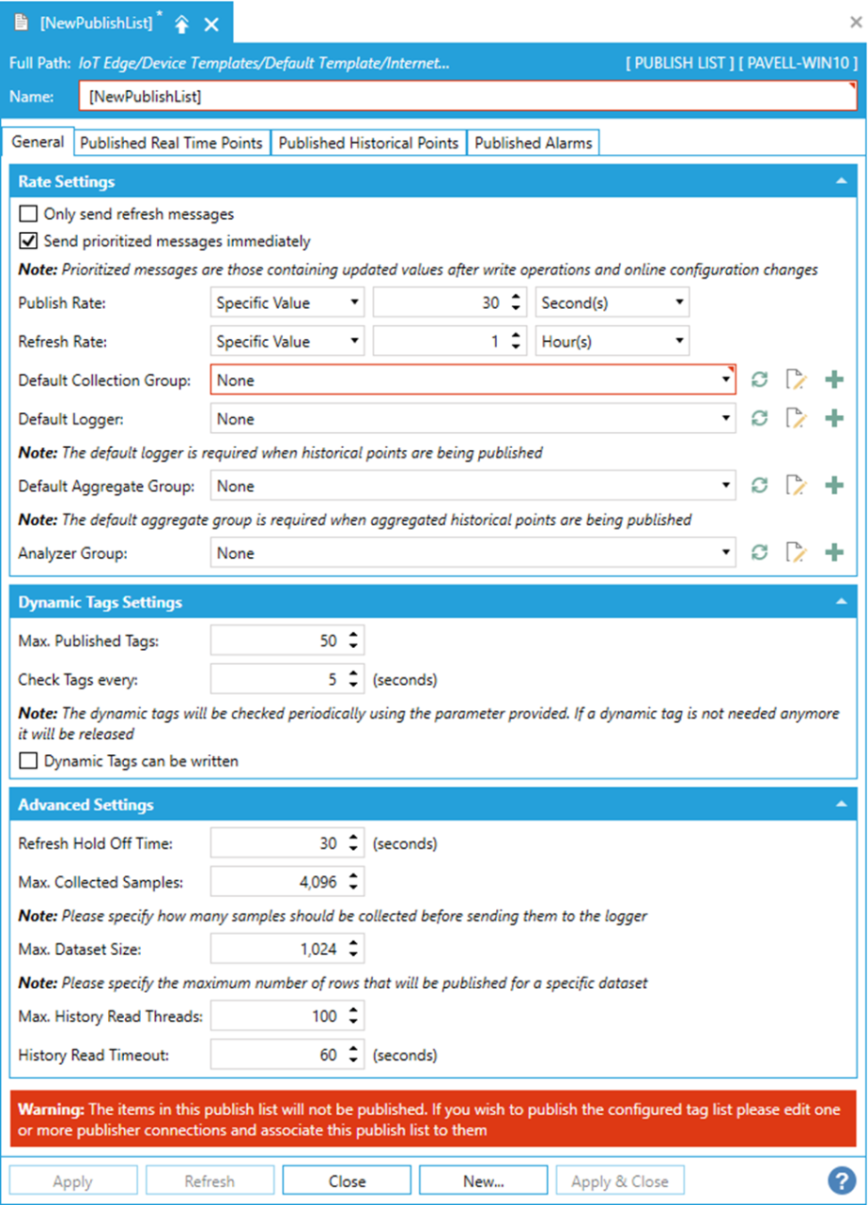
General Tab
Rate Settings
-
Only send refresh messages -Click this checkbox if you choose to only send Refresh messages. Selecting this option deactivates the Publish Rate setting below.
-
Send prioritized messages immediately - Prioritized messages are those containing updated values after write operations and online configuration changes. Such messages will be send immediately, not waiting for the publish action.
-
Publish Rate - Use the pulldown menu to select from either Specific Value or Trigger. If you select Specific Value, you can enter a rate in the nearby text entry field (or use the up/down arrows) and then select the units [Second(s), Minute(s), Hour(s), or Day(s)] in the pulldown menu to the right. If you select Trigger, you can enter a trigger in the text entry field or click on the
 button, which opens the Data Browser, allowing you to navigate to
your selected trigger. The publish rate defines how often changed
data values will be sent to the cloud.
button, which opens the Data Browser, allowing you to navigate to
your selected trigger. The publish rate defines how often changed
data values will be sent to the cloud. -
Refresh Rate - Use the pulldown menu to select from either Specific Value or Trigger. If you select Specific Value, you can enter a rate in the nearby text entry field (or use the up/down arrows) and then select the units [Second(s), Minute(s), Hour(s), or Day(s)] in the pulldown menu to the right. If you select Trigger, you can enter a trigger in the text entry field or click on the
button, which opens the Data Browser, allowing you to navigate to
your selected trigger. The refresh rate defines how often all data
will be sent to the cloud, including any values that have remained
unchanged. -
Refresh Hold Off Time - Enter a time in the first text entry field or use the up/down arrow buttons. In the next field, use the pulldown menu to select the units type from Second(s), Minute(s), Hour(s), or Day(s). This entry defines how long the IoT Publisher will wait after startup before sending the first refresh message.
-
Dynamic Tags Published - Enter the number of dynamic tags to publish in the text entry field (or use the up/down arrows). Subscribers are allowed to request points from a device that are not defined in its publish list. Such points are called "Dynamic Tags" and the settings here allow the user to limit how many of these tags can be requested.
-
Dynamic tags can be written - Click this checkbox to allow dynamic tags to be written.
-
Send prioritized messages immediately - Click this checkbox to send prioritized messages right away rather than wait for normal priority message rate settings. NOTE: Prioritized messages are those containing updated values after write operations and online configuration changes.
-
Default Collection Group - Use the pulldown menu to select a default from configured Collection Groups. Click on the
 button to refresh the
list of Collection Groups. Click on the
button to refresh the
list of Collection Groups. Click on the  button
to edit the list of existing Collection Groups. Click on the
button
to edit the list of existing Collection Groups. Click on the  button to add a new Collection Group. The collection group defines
how often the values for the points in the publish list are collected
on the device.
button to add a new Collection Group. The collection group defines
how often the values for the points in the publish list are collected
on the device. -
Default Logger - Use the pulldown menu to select a default from configured Loggers. Click on the
button to refresh the list of Loggers. Click
on the button to edit the list of existing Loggers.
Click on the button to add a new Logger. The
logger is used to log the tags that have been configured for Local
Buffering and HDA. -
Analyzer Group -Use the pulldown menu to select a default from configured Analyzer Groups. Click on the
button to refresh the list of Analyzer
Groups. Click on the
button to edit the list of existing Analyzer Groups. Click on the
button to add a new Analyzer Group.
Publisher Real Time Points Tab
Published Real Time Points Tab in the New Publish List Properties
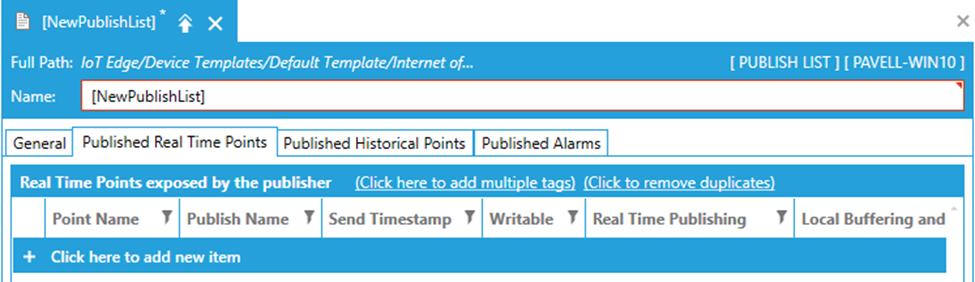
Specify the real time points that will be exposed by the publisher
You can add multiple points by clicking on Click here to add multiple tags. This opens the Data Browser where you can navigate to your selected tags.
You can also click on Click to remove duplicates which will delete any identical published points.
You can add single points by clicking on + Click here to add new item. This changes the property window, as shown below.
Added Point Name Entry
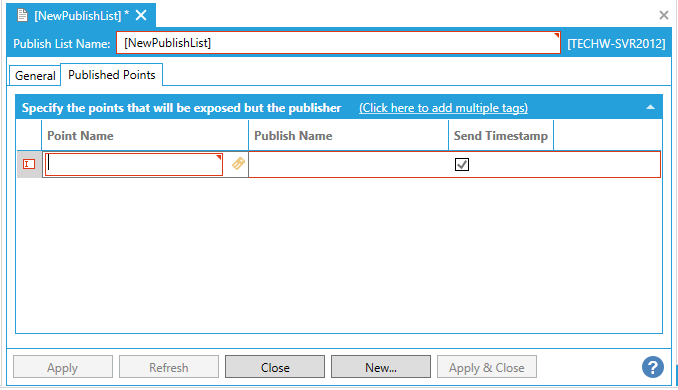
Enter a Point
Name or click on the  button to open the Data
Browser and navigate to your selected tag. Enter a Publish
Name for how you want this data point to appear in the IoT Hub.
Ensure that the Send Timestamp
checkbox is checked (it is checked by default) if you want timestamp information
taken from the data source directly to be included with the data point.
You can select if the point is Writable
or not via the checkbox. You can opt for the selected point, via
checkbox, whether you want to associate it with Real
Time Publishing, Local Buffering
and HDA, and/or Cloud Buffering
and HDA (if enabled). You can enter a Deadband
in the text entry field for that cell. You can also select the associated
Collection Group and Logger
via those columns'' pulldown menus.
button to open the Data
Browser and navigate to your selected tag. Enter a Publish
Name for how you want this data point to appear in the IoT Hub.
Ensure that the Send Timestamp
checkbox is checked (it is checked by default) if you want timestamp information
taken from the data source directly to be included with the data point.
You can select if the point is Writable
or not via the checkbox. You can opt for the selected point, via
checkbox, whether you want to associate it with Real
Time Publishing, Local Buffering
and HDA, and/or Cloud Buffering
and HDA (if enabled). You can enter a Deadband
in the text entry field for that cell. You can also select the associated
Collection Group and Logger
via those columns'' pulldown menus.
Publisher Historical Points Tab
Published Historical Points Tab in the New Publish List Properties
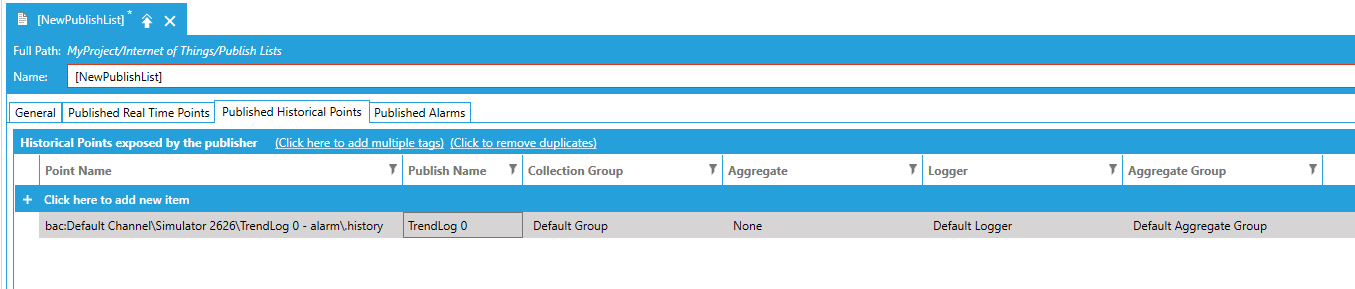
Specify the historical points that will be exposed by the publisher
Similarly to the Published Real Time Points, the list of historical points exposed by the publisher can be specified.
Specific configuration details for BACnet Trends can be found here.
Published Alarm Tab
Published Alarm Tab in the New Publish List Properties
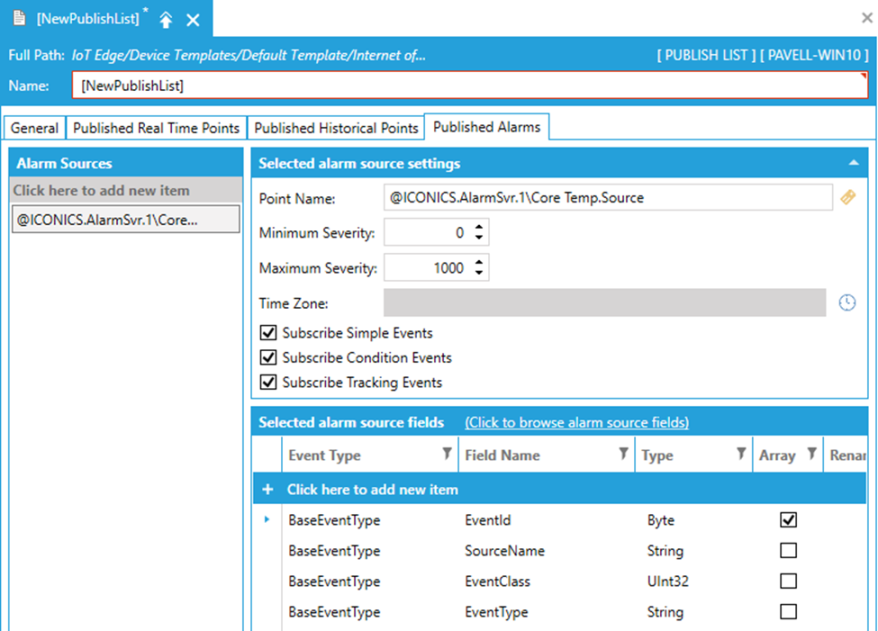
Specify the alarms that will be exposed by the publisher
-
You can add Alarm Sources from which the alarms will be exposed by clicking on Click here to add new item. This opens the Data Browser where you can navigate to your selected alarm source, which might be the alarm server or just a specific area.
-
You can then specify settings of the selected alarm source.
-
You can add alarm source fields clicking on Click to browse alarm source fields. This allows importing event types and properties from the selected IoTWorX gateway.
-
Click Apply to save your changes and Close to return to the Workbench. Your new Publish List will now appear in the Project Explorer.
See Also:
Publish List Configuration Simplified