Advanced Historical Data Source Type Settings
When configuring an equipment or equipment class property, you can set up historical data logging for this property on the Historical Data tab of the property configuration.
Prerequisites:
-
Enable the Assets extension for Data Historian. Learn more
-
Set up the real-time data source for the property on the Real-time Data tab. Learn more
On the Historical Data tab, select the Source type. The default setting is Disabled, which means that the equipment property is not connected to any real-time data. Once you select another option, the settings for the selected data source type are displayed.
The most commonly used type is Historical Data Source. Its configuration is described in Adding Historical Data to an Asset.
However, you can select any of the following more advanced options:
Source type: Historical Tag
When selected, the data source for the specific equipment property is an existing Data Historian tag.
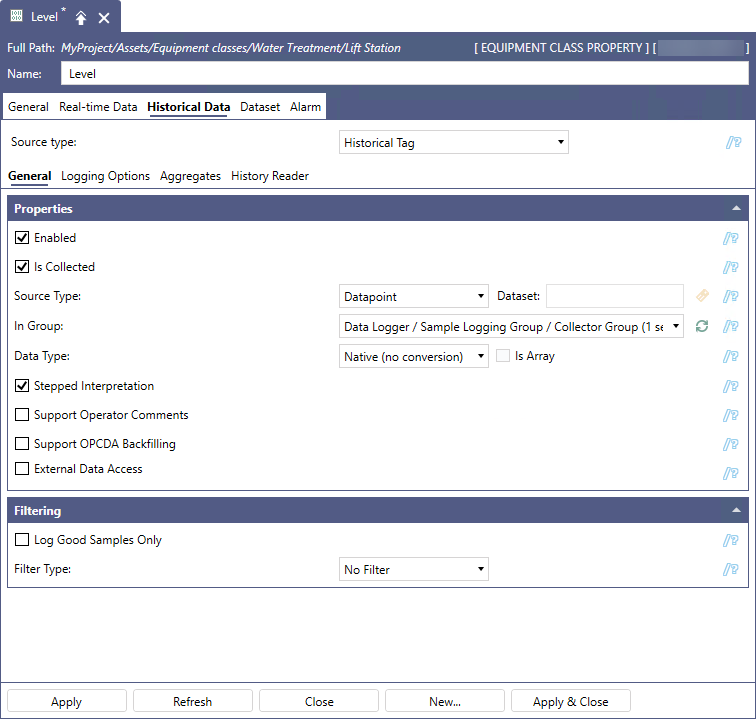
To configure a historical tag:
-
On the General tab in the Properties section, select Enabled, and then complete the remaining settings as desired.
Setting
Description
Is Collected
Select if the Data Historian tag's data is collected by the collector from a signal.
Clear if the tag's data is collected and written directly to the logger using other means, such as a Trend Viewer or a .csv file via Data Historian Importer.As a result, the tag's Signal Name field becomes disabled, as does the Filtering field and the Log to Disk options on the Logging Options tab, described in step 4.
Source Type
Select one of the following source types of the data signal associated with the tag:
- Datapoint—Recommended for processing OPC DA, OPC UA, and Database Connector data.
- Dataset—Recommended for processing BACNet data.
- Dataset Generic
Dataset
Active when Dataset or Dataset Generic is selected in Source Type.Do one of the following:
- Leave the field blank if the data set contains only one value or a default set of column names.
- Enter the user-defined name that appears at the end of each column name in the data set.
For example, if your data set includes columns named Value_test and StatusCode_test, enter test.
In Group
Select the group in which the tag should appear within the configuration database. Click
 to load the current list of groups.
Data Type
Select the desired type of the values (Native, Boolean, a floating point number, a signed or unsigned integer, String, Duration, or DateTime).
Is Array
Select the checkbox if the data type is an array.
Stepped Interpretation
When enabled, it is used primarily during playback for interpreting the tag’s data values. This feature is applied only if you request a value for a certain point of time (in the Log to Disk option on the Logging Options tab). The returned value is the nearest older value available.
In general, select the checkbox if the data comes from a discrete signal, such as an on/off switch (or a Boolean data type). If the data comes from a sine wave or analog signal, leave the box cleared.
Support Operator Comments
Select to allow operators to comment on the signal in displays.
You may want to enable annotating the tag’s data values when displaying it in Trend Viewer. For example, you may want to note an operator action that slightly altered the data, or highlight a piece of data for later analysis. The annotations are saved with the tag’s data in its logger file, which makes them available in a replay, accessible to the Data Historian SQL Server Interface, and archived with the tag’s data.
Support OPCDA Backfilling
Select to enable backfilling from devices via OPC DA. When enabled, all filters on the collector are disabled.
-
In the Filtering section, select Log Good Samples Only to exclude bad quality data from logging.
-
In Filter Type, select one of the following options to determine the value(s) of the signal to log to disk.
-
No Filter
-
Deadband
In the Deadband section that is displayed, select Absolute or Percent to set the threshold as either an absolute value or percentage, and then enter the value in the text box.
The Deadband filter in Data Historian is performed by the collector on incoming data. It serves as the front line for all filtering logic.
-
Swinging Door
In the Threshold section, select Absolute or Percent to set the threshold as either an absolute value or percentage, and then enter the value in the text box.
In the Period section, set the maximum and minimum period in milliseconds.
 [More Information]
The Swinging Door filter in Data Historian is implemented by the Logger on incoming values it receives from the Collector. It serves as the last-line of the filtering logic. The swinging door filters off values based on difference of consequent values from linear trend; if the difference is below defined threshold, new value is ignored.
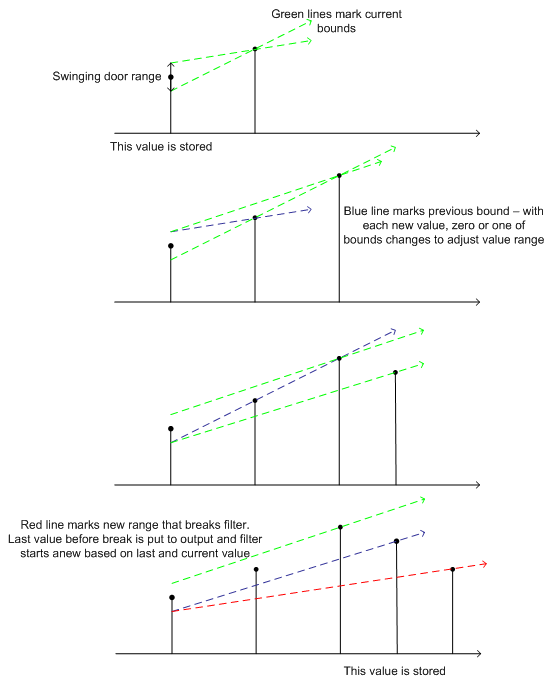
Swinging door is a generalization of a deadband filter. Swinging door filters off values following certain linear trend. It starts with one value (the first one is always forwarded to storage). Two tangents are considered, originating above and below base value in defined filter range. Tangents are effectively defined by second value in filter (see example). As subsequent values come in, tangents are adjusted to form geometrical region encompassing all values in filter so far.
Geometrically, as long as tangents don’t intersect prior to base value (i.e. the region defined by tangents is not broadening – hence commonly used filter name), the filter is valid. When a new value causes the region to open up, the filter is flushed – the last value prior to the breaking one is dumped to storage and the filter is re initialized using that value and the breaking one.
There are certain guaranties about maximum deviation of values filtered off (the difference of ignored value from stored trend can’t be higher than distance between tangent base points considered above and below base point).
Filter configuration is similar to deadband’s:
-
It can be either disabled or enabled.
-
If enabled, it is possible to configure its range as either of the following:
-
As an absolute value (non-negative)
-
As a percentage of value range (max—min) defined for the tag
-
Besides these parameters, there are two additional ones:
-
Minimum distance between values; if two subsequent values are closer (time-wise) than the defined threshold, the new value is ignored.
-
Maximum distance of values; if the distance between the last stored value (physically) and incoming value is higher (time-wise) than the defined threshold, the filter is flushed as if the new value would be a breaking one.
Swinging Door filter example:
-
-
-
On the Logging Options tab, select the Aggregate Type.
The Logging Options and Aggregates tabs are only active when the Enabled checkbox on the General tab is selected.
-
On the Aggregates tab, click Refresh Aggregate Groups to display the latest list of available aggregate groups in the table below.
-
Select Click here to add new item to add a new aggregate group to the list, and then configure the fields in the new row.
-
Select the Enabled checkbox.
-
In Aggregate Type, select the desired option from the drop-down list.
-
Enter Aggregate Name and Display Name.
The Display Name may be auto-filled according to previous settings.
-
-
Repeat step 6 to add multiple aggregates. When finished, click Apply.
Source Type: Historical Calculated Tag
When selected, a Data Historian calculation is created using the configured calculation expression.
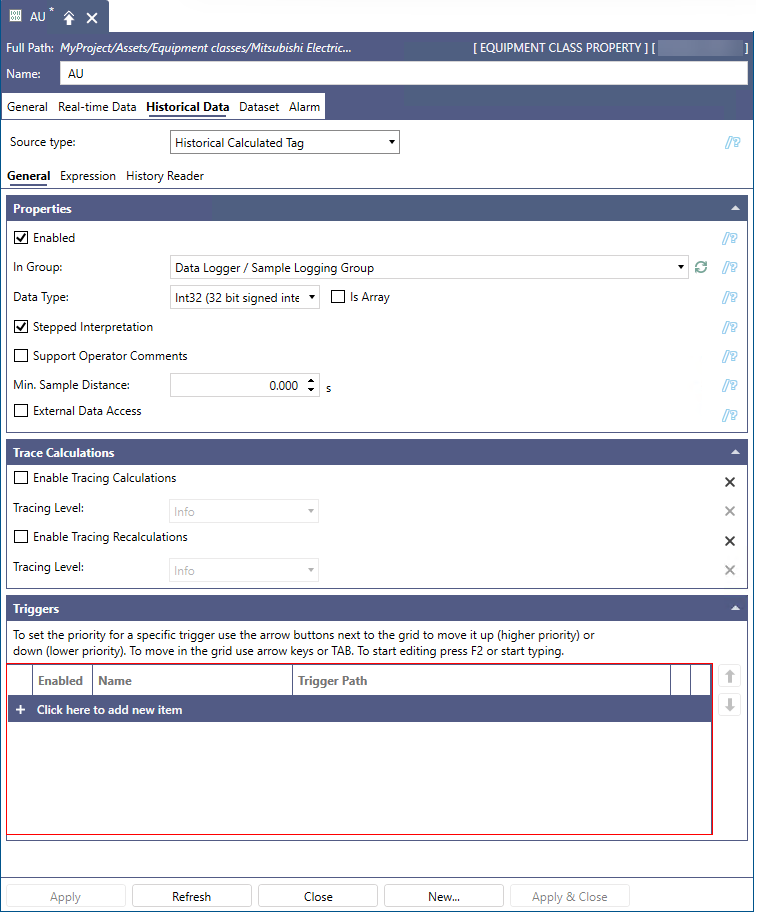
To configure a historical calculated tag:
-
On the General tab in the Properties section, select Enabled, and then complete the remaining settings as desired. Learn more
-
(Optional) In Trace Calculations, enable tracing calculations and recalculations, and then select the desired tracing level.
-
In the Triggers section, add the triggers that determine when the calculations occur. (The triggers must be predefined in Data Historian.) Then switch to the Expression tab and define the expression for the calculation.
For more details, refer to Creating a Calculated Tag in Data Historian, steps 5 to 7.
-
When finished, click Apply to save your settings.
Source Type: Merged Tag
When selected, a Data Historian merged tag is used to populate the historical data for the equipment property.
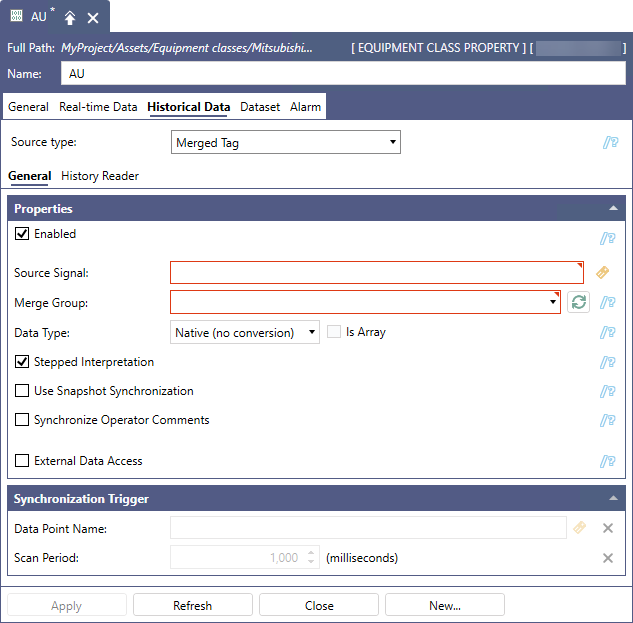
To configure a merged tag:
-
On the General tab in the Properties section, select Enabled.
-
In Source signal, enter the desired data source or click
 to select it in Data Browser.
The Source Signal field supports limited Static String Replacement (SSR), specifically:
-
Any runtime parameters are replaced by their default value (even if the default value is empty).
-
The .Name static point name is recognized if directly attached to a relative reference; for example, <<@@self/.Name>>, <<@@property.Name>> are resolved properly.
-
Relative references such as @@self/ are not supported and are not replaced by their full path.
Merged tags should point directly to remote Data Historian or other remote historical servers; they should not point back to Assets.
-
-
In Merge Group, select the desired group for the tag.
By default, the Merge Group drop-down list is populated with all available merge groups, and the first one is selected.
-
Complete the remaining settings as desired, and then click Apply.
-
In Data Type, select one of the standard simple types (Boolean, String, Date Time, Duration, floating point, or integer), or keep the default Native type with no conversion.
-
Select IsArray to identify that the data type is array-based.
-
Select External to allow an external data source to be used without a proper license.
-
In the Synchronization Trigger section, set the Data Point Name and Scan Period for a specific data trigger change (specified in Merge Group).
-