Fault Detection Overview
Fault Detection is a predictive building automation that detects and reports equipment failures or abnormal operating conditions. It incorporates algorithms that weigh the probability of faults and advise management, operators, and maintenance personnel of ways to prevent equipment failures or excessive use of energy.
Faults are exposed as OPC UA alarms. Alarms and Notifications specifications define how OPC A&E-enabled servers generate events to notify operators about various occurrences in the system. GENESIS alarm servers are fully OPC A&E-compliant event servers that provide a mechanism to scan data point values and evaluate logical conditions generating alarms—or faults. When equipment failures occur, potential causes are listed and sorted by probability.
Fault Diagnostic Models
You can configure Fault Detection in Workbench. In the Project Explorer, expand Analytics > Fault Detection.
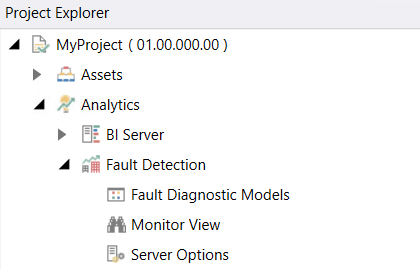
Right-click Fault Diagnostic Models and select Add Diagnostic Model Folder. Give the diagnostic model folder a unique name. Click Apply to save and continue making changes or click Apply & Close.
You must add a diagnostic model to the new diagnostic model folder. Right-click the folder and select Add Diagnostic Model. Then, repeat the steps to name and save the model.
In a diagnostic model, you have to add at least one Possible Cause and a Diagnostic Symptom for each cause. Learn more
Monitor View
Monitor View presents application-specific statistics, so you can visualize what the application is doing and what can be managed.
Server Options
The Server Options node allows users to set options for Symptom Alarms Subscription, Timings and Related Values, and Fault Incidents Logging.
-
Symptom Alarms Subscription—You can add and edit Event Points.
-
After opening the tab, click into the blank data entry field and click
 to select an Event Point from the Data Browser.
 -
To add a new item, click
 and repeat the previous steps. You can configure the items' Min. Severity, Max. Severity, and Alarm Type by clicking into the corresponding data entry fields.
 -
Click Apply to save your settings and continue editing or click Apply & Close.
Right-click on an item to delete it from the list.
-
-
Timings and Related Values—You can edit Time Settings and Related Value Mapping that can be viewed when examining faults in Fault Viewer.
-
Fault Incidents Logging—By default, the Fault Detection engine logs fault incidents to the same database as the configuration, but you can also use a custom database.