Pen Options for Trends
A pen is an object that plots values on a chart in a TrendWorX64 viewer; it is the connection between the data source and your trend display. A pen writes the data point as well as the connection properties between data points. You can have any number of pens of the same and differing styles that plot together on a chart. A chart's pens can display trend data for the following types of tags: OPC UA (Unified Architecture), OPC DA (real-time data), and OPC HDA (historical data).
Runtime users can manipulate pens during runtime if the chart has a Legend that includes certain options. For example, if the legend includes the Visibility field, runtime users can show and hide individual pens in the chart. Runtime users can also isolate a pen to its own chart during runtime. For more about the legend, refer to Legend Options for Trend Charts. For more about what runtime users can do, refer to Runtime Operations in TrendWorX.
To customize a pen, use the TrendWorX64 Viewer Configurator. Select the pen you wish to customize in the tree navigation area on the left. The pen's configurator has the following tabs:
The Advanced tab contains the pen's properties; you can also set many of these properties using the other four tabs. You can even select multiple pens that are writing to different plots and change each of their properties simultaneously using the Advanced tab.
|
|
Warning. Not all TrendWorX64 features are supported in Microsoft Silverlight. If you are saving Silverlight files, refer to Silverlight Files in GENESIS64 for more information. |
General Tab
On the General Tab (shown below), there are two sections that map to property settings on the pen's Advanced tab. The sections are: Data and Appearance.
The Pen's General Tab
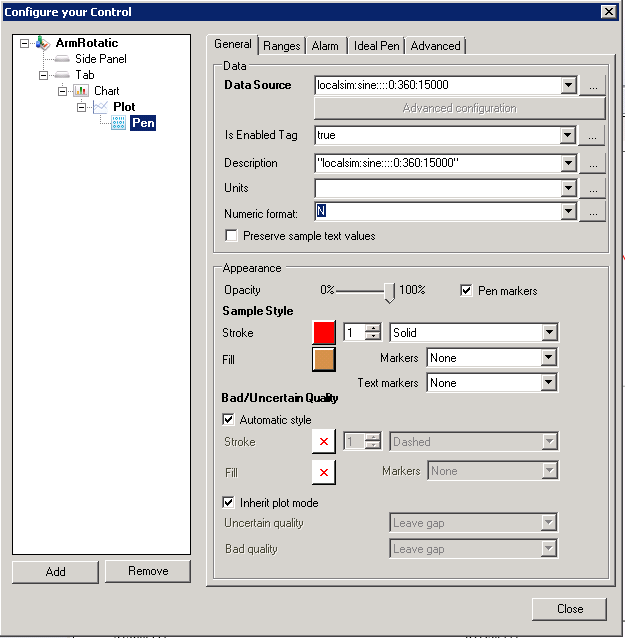
Data:
-
Data Source: Sets the data source for the pen. The Data Source property indicates the type of data source that is being displayed in the type name box next to the Data Source label. Click the ellipsis button
 to open the Data Browser and select
the data source for the pen. Data sources can be OPC UA
, DA, and HDA servers, or simulators. You can also use aliases to
construct the path and name of the data sources.
to open the Data Browser and select
the data source for the pen. Data sources can be OPC UA
, DA, and HDA servers, or simulators. You can also use aliases to
construct the path and name of the data sources.
|
|
Warning: When adding a Historical Pen, the tag syntax must be absolutely correct; in particular, these tags are case-sensitive. Otherwise you may receive error messages such as 'BadNoMatch' and/or 'BadUnexpectedError'. A tag with some upper-case characters and a tag with all lower-case characters are considered two different tags. |
-
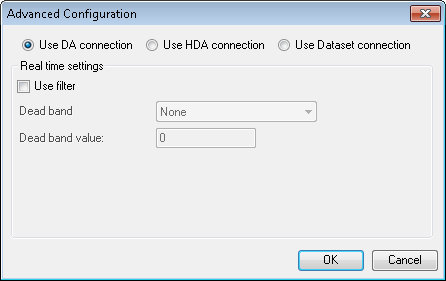
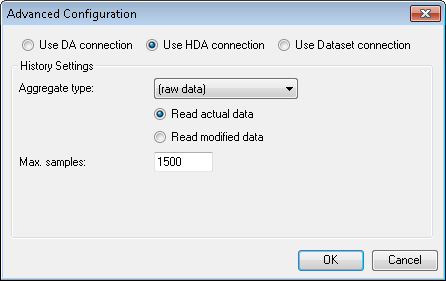
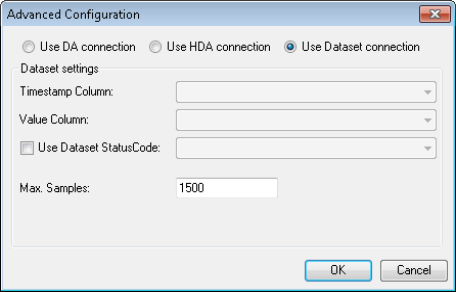
Advanced Configuration: Clicking this button opens a new dialog which allows you to select the pens connection type (DA, HDA or Dataset). Depending on the choice of the connection type, you can choose to:
-
-
 Choose
an Aggregate Type if you choose HDA connection
- If the aggregate type was raw data then users can specify an
aggregate type, whether to read the actual data or modified data,
and the maximum number of samples to be shown.
Choose
an Aggregate Type if you choose HDA connection
- If the aggregate type was raw data then users can specify an
aggregate type, whether to read the actual data or modified data,
and the maximum number of samples to be shown. -
Select
the value and timestamp columns if you choose a dataset connection
- You can display numbers (as coordinates) or text (as labels)
instead of time along the x-axis by enabling the Convert
X Axis To String check box in this view of the
dialog.
-
Is Enabled Tag: Enter a value or click the ellipsis button
to use
an alias. If you enter an alias as the value for this tag, the pen
will display data as long as the alias is not reporting blank or empty
values. Leave this field blank if you wish to disable the pen. -
Description: This is the name given to the pen in the Tree control and on the display in the legend. Use the ellipsis button
to use aliases
to construct the label name. -
Units: Set the units via the drop-down menu or click on the ellipsis button
to open the Data Browser. -
Numeric Format: Select, insert or browse for a pattern string used to format numbers. Standard formats are:
-
-
C (Currency) - adds the local currency symbol to the value
-
D (Decimal) - converts integer values to decimal digits (0-9)
-
E (Exponential) - converts values to exponential format (102)
-
F (Fixed-point) - shows a fixed number of decimal places
-
G (General) - converts different value types using the default precision
-
N (Number) - formats a value with group separators (commas or decimal points)
-
P (Percent) - adds the percentage symbol to the value
-
X (Hexadecimal) - converts values to hexadecimal format (0-9, A-F)
-
More about standard numeric formats can be found at http://msdn.microsoft.com/en-us/library/dwhawy9k.aspx
More about custom numeric formats can be found at http://msdn.microsoft.com/en-us/library/0c899ak8.aspx
-
Preserve sample text values: Enabling this check box preserves string values for data samples and plots them as text elements rather than converting them to Y coordinates.
Appearance
[Note: Some appearance options may not
have relevance for all types of plots.]
-
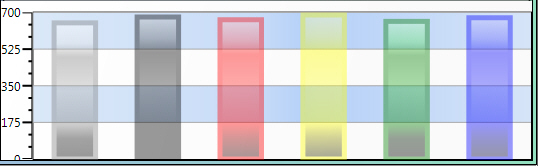
Opacity: This slider allows the pen line or area to show the background through it. For 100% the line is fully opaque and shows no background; while 50% would change the line color to be half the line color and half the background. The opacity setting allows you to set a value between 0%, where the plot is transparent, and 100%, where the plot is opaque.
Example of 50%
opacity. -
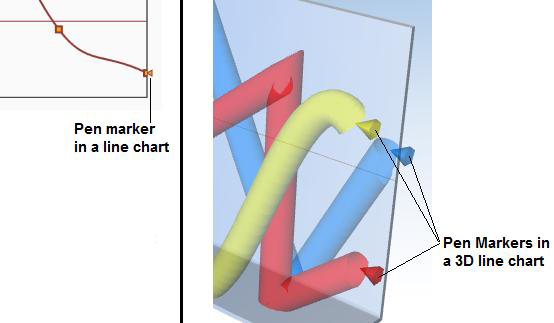
Pen Marker: Select this check box to show the pen marker place data points in the chart.
Click
here to see examples of pen markers.
Sample Style
-
Stroke and Fill: These color boxes allow you to set a color, gradient, or image pattern for the pen lines and areas, respectively. The Stroke box sets the width of the pen line, and the drop-down menu allows you to select whether the stroke appears as a Solid, Dashed, Dotted, Dotted-Dash, or Custom (Advanced) line.
-
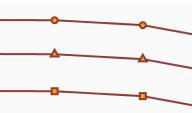
Markers: Setting the Markers property to None, Circle, Square, or Triangle chooses the symbol displayed at each data point in the display.
Click
here to see examples. For a display with a few
data points having a marker appear is quite valuable. You can use
those markers as indicators to move your mouse cursor over to view
a tooltip (an optional feature) that shows the data point values.
When you have a dense display of data points it may be advantageous
to hide the markers. -
Text Markers: Same options as for Markers.
Bad/Uncertain Quality
-
Automatic Style: Click this check box if you wish the style for the pen lines and areas of Bad or Uncertain Quality to be predetermined. Disable the check box if you wish to set the following criteria:
-
-
Stroke and Fill: These color boxes allow you to set a color, gradient, or image pattern for the Bad/Uncertain Quality pen lines and areas, respectively. The Stroke box sets the width of the pen line, and the drop-down menu allows you to select whether the stroke appears as a Solid, Dashed, Dotted, Dotted-Dash, or Custom (Advanced) line.
-
Markers: Setting the Markers property to None, Circle, Square, or Triangle chooses the symbol displayed at each Bad/Uncertain Quality data point in the display.
Click
here to see examples. For a display with a
few data points having a marker appear is quite valuable. You
can use those markers as indicators to move your mouse cursor
over to view a tooltip (an optional feature) that shows the data
point values. When you have a dense display of data points it
may be advantageous to hide the markers.
-
-
Inherit Plot Mode: Click this check box to use the existing plot mode for Bad/Uncertain Quality. Disable the check box in order to change the following settings:
-
-
Uncertain quality : For uncertain quality pen data, you can choose to either leave the uncertain quality values blank within the chart (Leave gap), plot the points anyway (Plot), or connect surrounding good quality data (Span Over).
- Bad quality:For bad quality pen data, you can choose to either leave the bad quality values blank within the chart (Leave gap), plot the points anyway (Plot), or connect surrounding good quality data (Span Over).
-
Ranges Tab
The Pen's Ranges Tab
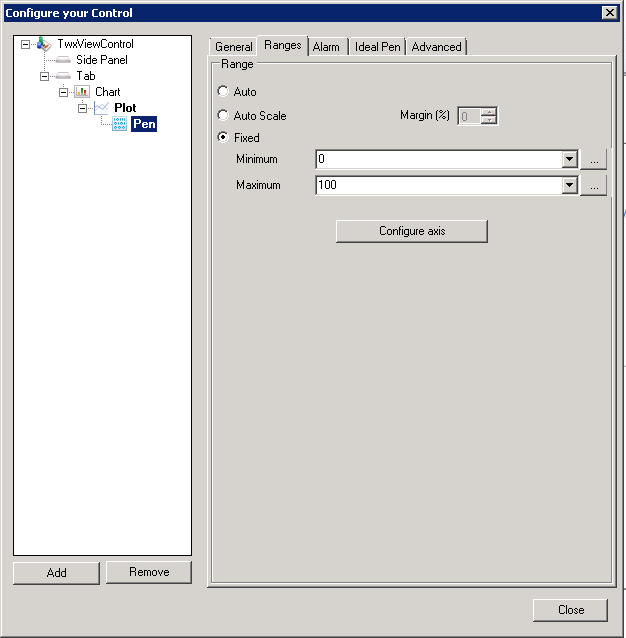
Range sets the scale of the Y-axis
-
Auto: Allows the data from the server to set the scale.
-
Auto Scale: Auto scale uses the highest range value as the top of the display, the lowest range value as the bottom of the display, and alters the values shown in the range scale to indicate the actual values being displayed.
-
Fixed: You can set the minimum and maximum scale values using the text boxes. If you click the ellipsis button
you
can use the Data Browser to use aliases to construct the range scale. -
Configure Axis button: Clicking this button opens the Configuration Axis dialog box, shown and described below.
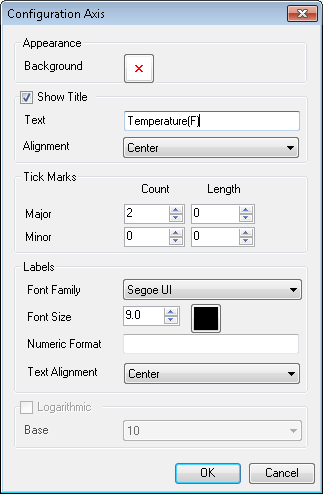
Configuration Axis Dialog Box for a Pen
-
-
Appearance: Click on the box in the Background section to pick a color, gradient, or image pattern to use for the y-axis.
-
Show Title: Select this option to show a title for the trend along the y-axis. If you select this option, enter the title in the Text field, and use the Alignment drop-down list to specify whether you want the title Centered, or aligned at one end of the y-axis or the other (Maximum or Minimum). The size of the title is determined by the font selections on this dialog box.
-
Tick Marks: Major and Minor: Sets the size of the tick marks along the y-axis. A higher count makes the tick marks appear closer together; a higher length makes them longer.
-
Labels: Set the Font Family and Font Size to be used for the y-axis's labels. Numeric Format allows you to set custom formatting for numerical values in axis labels (visit http://msdn.microsoft.com/en-us/library/dwhawy9k.aspx for more info). [Examples: "C" shows the number in form of currency; "P" shows the number in percentage; "0.0" shows the number with 1 decimal place; "0.000" shows the number with 3 decimal places.]. Text Alignment sets the alignment of text within that particular label (Left, Center, or Right).
-
Click OK when you are done.
-
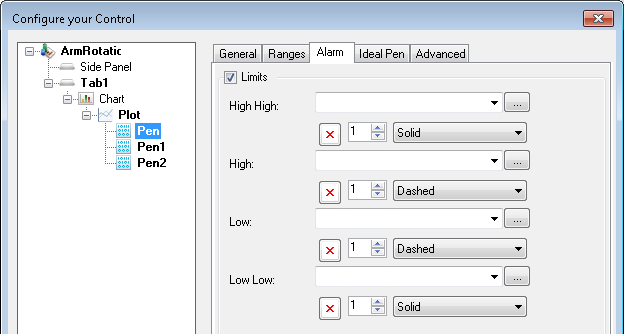
Alarm Tab
On the pen's Alarm tab (shown below), you can optionally set boundaries for the values that the pen writes. (Note that you can choose to display the numerical values of these limits in the chart's legend by using the chart's General tab.) You can click a field's ellipsis button to open the Data Browser where you can select an alias or tag that sets the limit.
-
High High: Shows a solid grid line in the chart at the level this value represents.
-
High: Shows a dashed grid line in the chart at the level this value represents.
-
Low: Shows a dashed grid line in the chart at the level this value represents.
-
Low Low: Shows a solid grid line in the chart at the level this value represents.
The Pen's Alarm Tab
Note that you can use the Pen's Advanced tab to further define the pen's capabilities. For example, while working with historical data, it is possible to add operator comments to the logged data at designated points in time. You can make such operator comments visible along with the data itself, to show an important information related to the data behavior in the particular moment. To do this, go to the pen's Advanced tab and set the pen's ShowOperator Comment property to True. For information about the pen's Advanced tab, go to the topic called Advanced Display Options.
Ideal Pen Tab
On the pen's Ideal Pen tab (shown below), you can (once the check box has been clicked) set a Start Date and Start Time for the Ideal Pen. The Ideal Pen is a very powerful tool that allows you to compare data from the same data source over two different periods of time simultaneously.
The Pen's Ideal Pen Tab
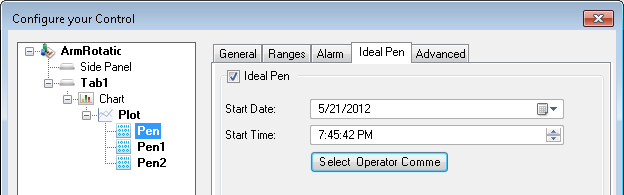
You can also click on the Select Operator Comment button, which opens the Select Operator Comment/Batch window shown below.
Select Operator Comment/Batch Window
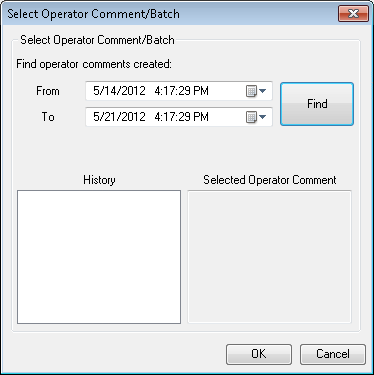
This window allows you to search for operator comments within a certain timeframe. Use the drop-down menus to set a "From" and "To" time period, then click on the Find button. Any comments meeting your date range criteria will be shown in the History field. Selected Operator Comments will appear in the field to the right. Click OK to return to the Ideal Pen tab.
Pens as Pick Actions in TrendWorX Viewer
The following pick action has been added for Pens: Add Pen
When selected the following properties will become available:
Name: The name of the TrendViewer (i.e. the name of the object in GWX64).
Tab: The name (or index) of the tab in the TrendViewer .
Chart: The name (or index) of the chart in the TrendViewer .
Pen Type: The type of pen, e.g. Real time Pen, Historical Pen.
Pen Name: The name of a pen, both static strings and dynamic string (GA, LA, OPC tags).
Period: The period of the trend window specified as a time period; allows you to specify days, hours, minutes, seconds.
See Also: