Advanced Display Options (TrendWorX)
Every object in an TrendWorX64 Viewer display has a set of ![]() Advanced properties that control a number of the fine features you see on a TrendWorX64 Viewer display. These properties appear on the TrendWorX64 Viewer Configurator's Advanced tab. Some properties are shared by different objects (such as the viewer, tabs, and charts), while other properties apply to one type of object and not the others. At the bottom of the Advanced tab is a tool tip panel, which you can resize for better viewing; select a property on the tab to view a description of that property in the tool tip panel.
Advanced properties that control a number of the fine features you see on a TrendWorX64 Viewer display. These properties appear on the TrendWorX64 Viewer Configurator's Advanced tab. Some properties are shared by different objects (such as the viewer, tabs, and charts), while other properties apply to one type of object and not the others. At the bottom of the Advanced tab is a tool tip panel, which you can resize for better viewing; select a property on the tab to view a description of that property in the tool tip panel.
-
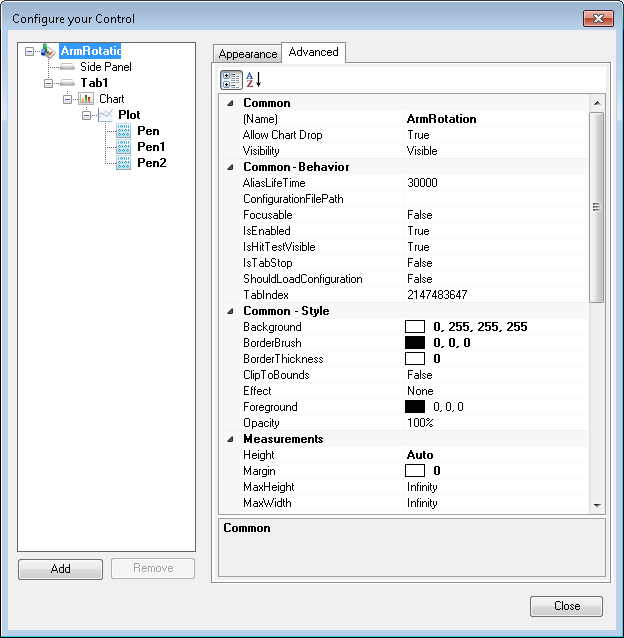
 Click here to see a sample Advanced tab of a TrendWorX64 Viewer object.
 -
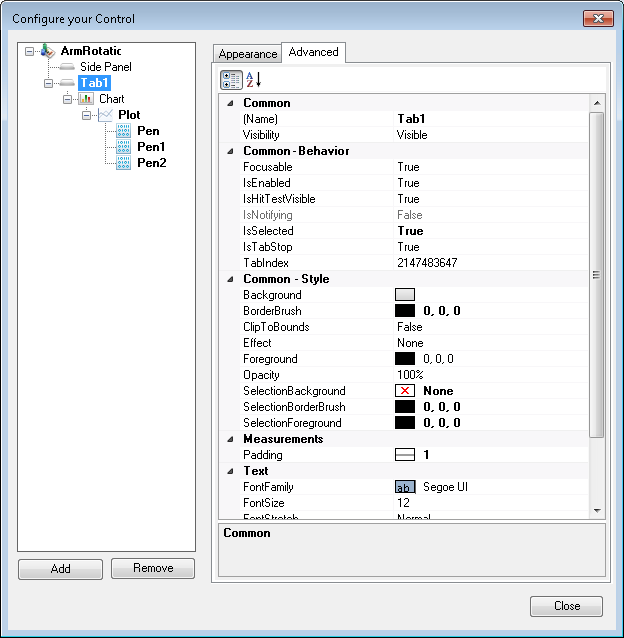
Click here to see a sample Advanced tab of a Tab object.
-
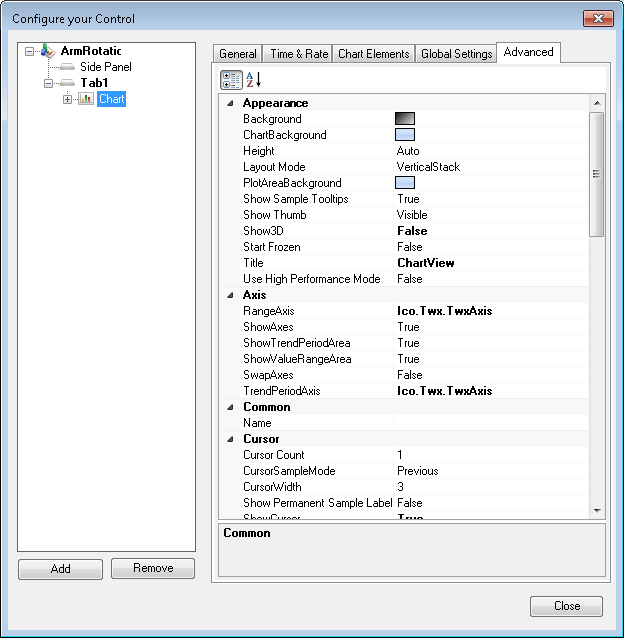
Click here to see a sample Advanced tab of a Chart object.
-
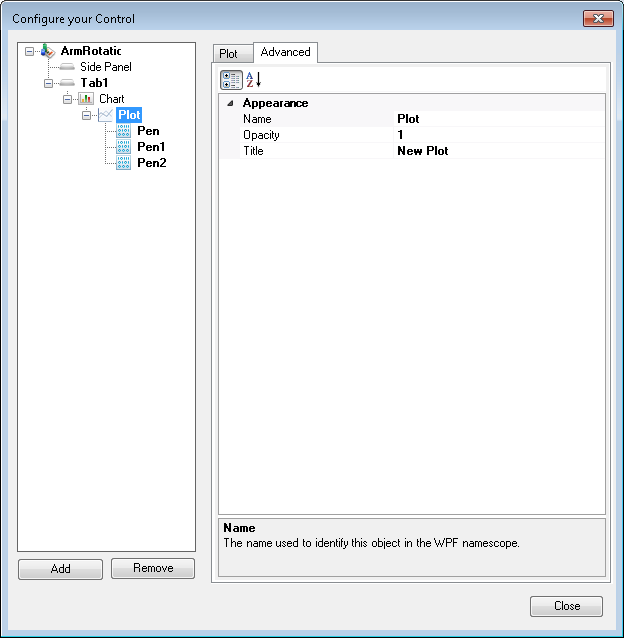
Click here to see a sample Advanced tab of a Plot object.
-
Click here to see a sample Advanced tab of a Pen object.
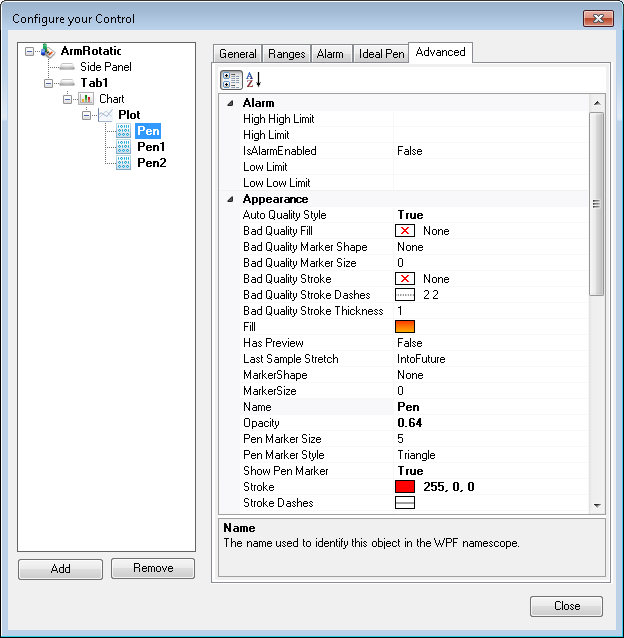
If you select multiple Pen objects in the TrendWorX64 Viewer Configurator, you can edit the properties of the Pen objects simultaneously. This works even if you select Pen objects that are writing to different plots.
|
|
Note: For a description of the Appearance tab, refer to Appearance Tab Options for TrendWorX. For a description of other options for a chart, refer to Chart Options. |
The following table summarizes the properties that are available for each type of object.
Advanced Options for a TrendWorX64 Viewer Control, Tab, and Chart
|
Property |
Settings |
Viewer |
Tab |
Chart |
Plot |
Pen |
|
Alarm Section |
||||||
|
High High Limit |
Number |
x |
||||
|
High Limit |
Number |
x |
||||
|
IsAlarmEnabled |
True/False |
x |
||||
|
Low Limit |
Number |
x |
||||
|
Low Low Limit |
Number |
x |
||||
|
Appearance Section |
Viewer |
Tab |
Chart |
Plot |
Pen |
|
| Auto Quality Style |
True/False |
x |
||||
|
Bad Quality Fill |
x |
|||||
| Bad Quality Marker Shape |
x |
|||||
| Bad Quality Marker Size |
Number |
x |
||||
| Bad Quality Stroke |
Color, pattern, or gradient |
x |
||||
| Bad Quality Stroke Dashes |
Solid, 3-3, 6-3, 6-3-3-3, 9-3, 9-3-3-3, or 9-3-3-3-3-3 |
x |
||||
| Bad Quality Stroke Thickness |
Number |
x |
||||
| Background |
Color, pattern, or gradient |
x |
||||
| ChartBackground |
Color, pattern, or gradient |
x |
||||
| Fill |
Color, pattern, or gradient |
x |
||||
| Has Preview |
True/False |
x |
||||
| Height |
Auto, or a number of pixels |
x |
||||
| Last Sample Stretch |
None, ToNow, or IntoFuture |
x |
||||
| LayoutMode |
Vertical stack, horizontal stack, or grid |
x |
||||
| MarkerShape |
None, Circle, Square, or Triangle |
x |
||||
| MarkerSize |
Number |
x |
||||
| Name |
String |
x |
x |
|||
| Opacity |
0% to 100% |
x |
x |
|||
| Pen Marker Size |
Number |
x |
||||
| Pen Marker Style |
None, Circle, Square, or Triangle |
x |
||||
|
Plot Area Background |
Color, pattern, or gradient |
x |
||||
| Show Sample Tooltips |
True/False |
x |
||||
| Show Thumb |
Visible, hidden, or collapsed |
x |
||||
| Show3D |
False/True |
x |
||||
| Show Pen Marker |
True/False |
x |
||||
| Start Frozen |
True/False |
x |
||||
|
Stroke |
Color, pattern, or gradient |
x |
||||
| Stroke Dashes |
Solid, 3-3, 6-3, 6-3-3-3, 9-3, 9-3-3-3, or 9-3-3-3-3-3 |
x |
||||
|
Stroke Thickness |
Number |
x |
||||
|
Text Marker Shape |
None, Circle, Square, or Triangle |
x |
||||
|
String |
x |
x |
||||
|
Title Tag |
String |
x |
||||
|
Trim Bad Samples |
True/False |
x |
||||
|
Use High Performance Mode |
True/False |
x |
||||
|
Units |
String |
x |
||||
|
Axis Section |
Viewer |
Tab |
Chart |
Plot |
Pen |
|
|
RangeAxis |
Submenu with properties |
x |
||||
|
ShowAxes |
True/False |
x |
||||
|
ShowTrendPeriodArea |
True/False |
x |
||||
|
ShowValueRangeArea |
True/False |
x |
||||
|
SwapAxes |
True/False |
x |
||||
|
TrendPeriodAxis |
Submenu with properties |
x |
||||
|
Viewer |
Tab |
Chart |
Plot |
Pen |
||
|
(Name) |
String |
x |
x |
x |
||
|
Allow Chart Drop |
True/False |
x |
||||
|
Visibility |
Visible, hidden, or collapsed |
x |
x |
|||
|
Common - Behavior Section |
Viewer |
Tab |
Chart |
Plot |
Pen |
|
| AliasLifeTime |
Number of milliseconds |
x |
||||
|
ConfigurationFilePath |
String (file path) |
x |
||||
|
Focusable |
True/False |
x |
x |
|||
|
IsEnabled |
True/False |
x |
x |
|||
|
True/False |
x |
x |
||||
|
IsNotifying |
False |
x |
||||
|
IsSelected |
True/False |
x |
||||
|
True/False |
x |
x |
||||
|
ShouldLoadConfiguration |
True/False |
x |
||||
| TabIndex |
Number |
x |
x |
|||
|
Common - Style Section |
Viewer |
Tab |
Chart |
Plot |
Pen |
|
|
Background |
Color, pattern, or gradient |
x |
x |
|||
|
BorderBrush |
Color, pattern, or gradient |
x |
x |
|||
|
Number of pixels |
x |
|||||
|
True/False |
x |
x |
||||
|
Effect |
x |
x |
||||
|
Foreground |
Color, gradient, or pattern |
x |
x |
|||
|
Opacity |
Percentage (0% to 100%) |
x |
x |
|||
|
SelectionBackground |
Color, gradient, or pattern |
x |
||||
|
SelectionBorderBrush |
Color, gradient, or pattern |
x |
||||
|
SelectionForeground |
Color, gradient, or pattern |
x |
||||
|
Cursor Section |
Viewer |
Tab |
Chart |
Plot |
Pen |
|
|
CursorCount |
Number |
x |
||||
|
CursorSampleMode |
Previous, closest, or next |
x |
||||
|
Number |
x |
|||||
|
Show Permanent Sample Labels |
True/False |
x |
||||
|
ShowCursor |
True/False |
x |
||||
|
ShowCursorOnRealtime |
True/False |
x |
||||
|
Data Section |
Viewer |
Tab |
Chart |
Plot |
Pen |
|
|
Bad Quality Plot Mode |
Gap, Plot, or SpanOver |
x |
||||
|
History RefreshRate |
hh:mm:ss.sssssss (hours, minutes, and seconds) |
x |
||||
|
Inherit Quality Plot Mode |
True/False |
x |
||||
|
IsEnabledTag |
String |
x |
||||
|
IsSessionBufferSizeAutomatic |
True/False |
x |
||||
|
MaxAutomaticSessionBufferSize |
Number |
x |
||||
|
Optimize History Refresh |
True/False |
x |
||||
|
Preserve String Values |
True/False |
x |
||||
|
SamplingInterval |
hh:mm:ss.sssssss (hours, minutes, and seconds) |
x |
||||
|
SessionBufferSize |
Number |
x |
||||
|
Uncertain Quality Plot Mode |
Gap, Plot, or SpanOver |
x |
||||
|
Use Real Time Interpolation |
True/False |
x |
||||
|
General Section |
Viewer |
Tab |
Chart |
Plot |
Pen |
|
|
Format |
String pattern |
x |
||||
|
Grid Section |
Viewer |
Tab |
Chart |
Plot |
Pen |
|
|
Line Color |
Color, gradient, or pattern |
x |
||||
|
Line Thickness |
Number |
x |
||||
|
ShowGrid |
True/False |
x |
||||
|
TrendPeriodGridVisibility |
None, OnlyMajor, or All |
x |
||||
|
ValueRangeGridVisibility |
None, OnlyMajor, or All |
x |
||||
|
Ideal Pen Section |
Viewer |
Tab |
Chart |
Plot |
Pen |
|
|
Ideal Start Time |
Date and time |
x |
||||
|
Is Ideal |
True/False |
x |
||||
|
Legend Section |
Viewer |
Tab |
Chart |
Plot |
Pen |
|
| LegendActiveSelectionBackground | Color, gradient, or pattern |
x |
||||
| LegendActiveSelectionForeground | Color, gradient, or pattern |
x |
||||
| LegendBackground | Color, gradient, or pattern |
x |
||||
| LegendBorderBrush | Color, gradient, or pattern |
x |
||||
| LegendBorderThickness | Number |
x |
||||
|
LegendDock |
Left, Top, Right, or Bottom |
x |
||||
|
LegendFontFamily |
String (font name) |
x |
||||
| LegendFontSize | Font size (in points) |
x |
||||
| LegendHeaderBackground | Color, gradient, or pattern |
x |
||||
| LegendHeaderBorder | Color, gradient, or pattern |
x |
||||
| LegendHeaderForeground | Color, gradient, or pattern |
x |
||||
| LegendInactiveSelectionBackground | Color, gradient, or pattern |
x |
||||
| LegendInactiveSelectionForeground | Color, gradient, or pattern |
x |
||||
| LegendScrollbarBackground | Color, gradient, or pattern |
x |
||||
| LegendScrollbarForeground | Color, gradient, or pattern |
x |
||||
| LegendScrollbarHoverColor | Color, gradient, or pattern |
x |
||||
| ShowColoredDetails |
True/False |
x |
||||
|
ShowHeader |
True/False |
x |
||||
| ShowLegend |
True/False |
x |
||||
| ShowTotalizerEngineeringUnits |
True/False |
x |
||||
| Measurements Section |
Viewer |
Tab |
Chart |
Plot |
Pen |
|
|
Height |
Auto, or number of pixels |
x |
||||
|
Margin |
0 to 10 (see note) |
x |
||||
|
Infinity, or a number of pixels |
x |
|||||
| Infinity, or a number of pixels |
x |
|||||
| Number of pixels |
x |
|||||
|
Number of pixels |
x |
|||||
|
Padding |
0 to 10 (see note) |
x |
x |
|||
|
Width |
Auto, or a number of pixels |
x |
||||
| Misc Section |
Viewer |
Tab |
Chart |
Plot |
Pen |
|
|
Series |
(Collection); click  to add tags to add tags |
x |
||||
|
Misc - Commanding Section |
Viewer |
Tab |
Chart |
Plot |
Pen |
|
|
CommandingDisplayName |
String |
x |
||||
|
CommandingEnabled |
True/False |
x |
||||
|
DragAndDropCommandingEnabled |
True/False |
x |
||||
|
Operator Comment Section |
Viewer |
Tab |
Chart |
Plot |
Pen |
|
|
Show Operator Comment |
True/False |
x |
||||
|
Pen Section |
Viewer |
Tab |
Chart |
Plot |
Pen |
|
|
Show Disabled Pens |
True/False |
x |
||||
|
Printing Section |
Viewer |
Tab |
Chart |
Plot |
Pen |
|
|
Use Economy Printing |
True/False |
x |
||||
|
Range Section |
Viewer |
Tab |
Chart |
Plot |
Pen |
|
|
RangeAxis |
Submenu with properties |
x |
||||
|
RangeMaximumTag |
Number |
x |
x |
|||
|
RangeMinimumTag |
Number |
x |
x |
|||
|
RangeMode |
Default, Manual, or AutoScale |
x |
x |
|||
|
ShowSignalMarkers |
True/False |
x |
||||
|
VisibleValueRanges |
Number |
x |
||||
|
RangeMode Section |
Viewer |
Tab |
Chart |
Plot |
Pen |
|
|
Auto Scale Margin |
Number (represents a percentage) |
x |
x |
|||
|
Rates Section |
Viewer |
Tab |
Chart |
Plot |
Pen |
|
|
Historical Update Sync |
True/False |
x |
||||
|
RefreshRate |
hh:mm:ss.sssssss (hours, minutes, and seconds) |
x |
||||
|
Side Panel Section |
Viewer |
Tab |
Chart |
Plot |
Pen |
|
|
Show Side Panel |
True/False |
x |
||||
|
Side Panel Dock |
Left, Top, Right, or Bottom |
x |
||||
|
SummaryChart Section |
Viewer |
Tab |
Chart |
Plot |
Pen |
|
|
HistoryTrendPeriod |
d.hh:mm:ss.sssssss (days, hours, minutes, and seconds) |
x |
||||
|
ShowSummaryChart |
True/False |
x |
||||
|
SummaryChartDock |
Left, Top, Right, or Bottom |
x |
||||
|
Time Section |
Viewer |
Tab |
Chart |
Plot |
Pen |
|
|
CustomDateTimeFormat |
String |
x |
||||
|
CustomLabelTimeFormat |
String |
x |
||||
|
LabelDateFormat |
Custom, Short, or Long |
x |
||||
|
LabelDateTimeMode |
TimeOnly, DateOnly, TimeAndDate, or DateAndTime |
x |
||||
|
LabelDateTimeSeparator |
String |
x |
||||
|
LabelTimeFormat |
Custom, Short, or Long |
x |
||||
|
Time Shift Section |
Viewer |
Tab |
Chart |
Plot |
Pen |
|
|
Time Shift |
hh:mm:ss (hours, minutes, and seconds) |
x |
x |
|||
|
Trend Period Section |
Viewer |
Tab |
Chart |
Plot |
Pen |
|
|
Show Trend Period Tool Bar |
True/False |
x |
||||
|
TickmarkTimeAlignment |
hh:mm:ss (hours, minutes, and seconds) |
x |
||||
|
TickmarkTimeAlignment |
Custom, Second, Minute, Hour, Day, Week, Month, or Year |
x |
||||
|
TrendPeriod |
d.hh:mm:ss (days, hours, minutes, and seconds) |
x |
||||
|
Trend Period Buttons |
Collection; click |
x |
||||
|
UseTickmarkTimeAlignment |
True/False |
x |
||||
|
Text Section |
Viewer |
Tab |
Chart |
Plot |
Pen |
|
|
FontFamily |
String (font name) |
x |
x |
|||
|
FontSize |
Font size (in points) |
x |
x |
|||
|
FontStretch |
Normal, Condensed, or Expanded |
x |
x |
|||
|
FontStyle |
Normal or Italic |
x |
x |
|||
|
FontWeight |
Normal or Bold |
x |
x |
|||
|
ToolBar Section |
Viewer |
Tab |
Chart |
Plot |
Pen |
|
| IsToolBarAllowed | True/False |
x |
||||
|
IsToolBarFloating |
True/False |
x |
||||
|
ToolBarPlacement |
Left, Top, Right, or Bottom |
x |
||||
|
ToolBarVisibility |
Visible, Hidden, or Collapsed |
x |
||||
|
Viewer |
Tab |
Chart |
Plot |
Pen |
||
|
True/False |
x |
x |
||||
| Zoom Section |
Viewer |
Tab |
Chart |
Plot |
Pen |
|
|
Show Range Zoom Ruler |
True/False |
x |
||||
|
Simple Wheel Zoom |
True/False |
x |
||||
 to open the TrendPeriodButton Collection Editor
|
|
Note: Margin and padding values can be a single number for a uniform amount on all four sides of an object, a pair of numbers (separated by a comma) that represents the top/bottom amount and the left/right amount, respectively, or a set of four numbers (separated by commas) that represents the top, right, bottom, and left amounts, respectively. |
See also: