Legend Options for Trend Charts
In the TrendWorX64 Viewer, charts can be configured so
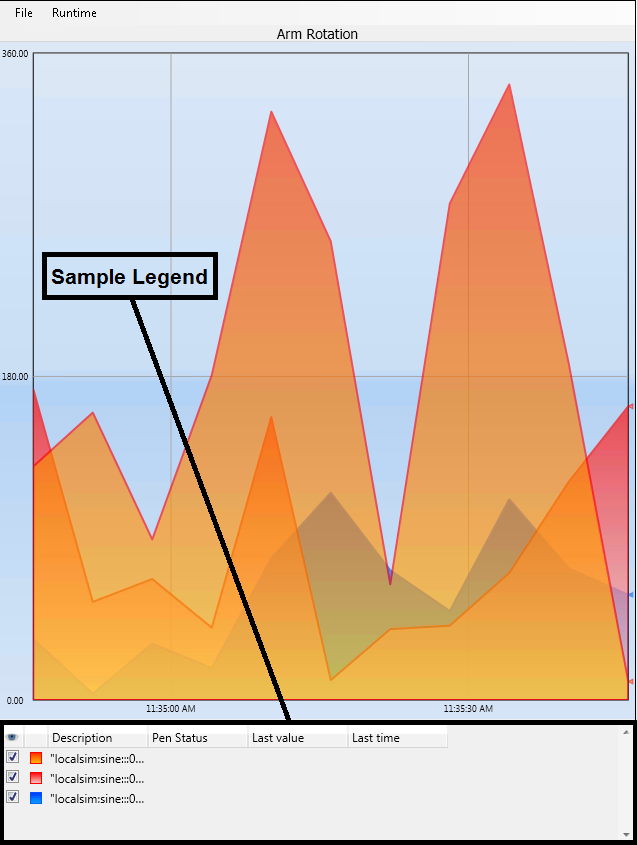
that a legend provides options to runtime users. ![]() Click
here to see an example of what a legend looks like.
The legend provides a few benefits to runtime users of the chart. Runtime
users can:
Click
here to see an example of what a legend looks like.
The legend provides a few benefits to runtime users of the chart. Runtime
users can:
-
Change or hide individual legend options:
-
-
Click the Show/Hide Legend button on the runtime toolbar to display the legend. You can also click theLegendbutton in the Trend Layout group on theTrendWorX64 Runtimeribbon.
-
Click the Edit Pens button on the runtime toolbar to display the
 TrendWorX64 Runtime configurator.
You can also click the Pens
button in the Edit group on the TrendWorX64
Runtime ribbon.
TrendWorX64 Runtime configurator.
You can also click the Pens
button in the Edit group on the TrendWorX64
Runtime ribbon. -
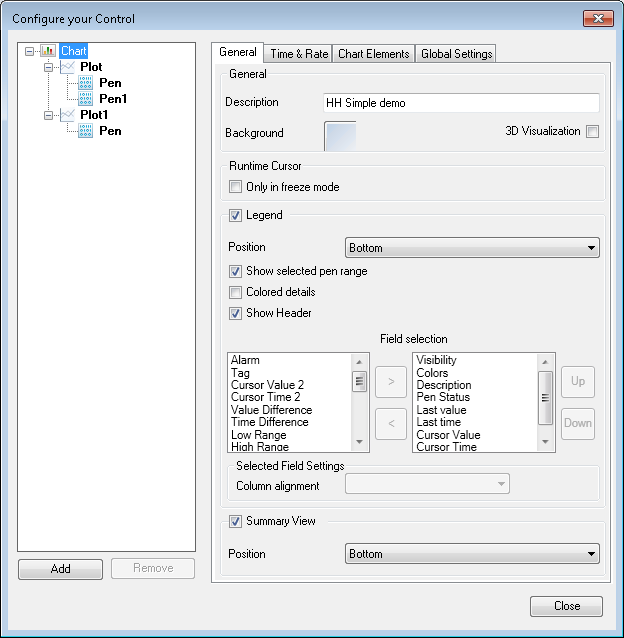
Click a Chart object in the left tree navigation area (if the one corresponding to the legend you wish to edit is not already selected).
-
In the Field selection area on the General tab, select a legend option you wish to show in the left list box. Click the > (right arrow)button between the list boxes to show this legend option.
-
In the same area, select a legend option you wish to hide in the right list box. Click the < (left arrow) button between the list boxes to hide this legend option.
-
Repeat steps 4 and 5 to show and hide other legend options.
-
Click the Close button to exit the TrendWorX64 Runtime configurator.
-
-
Isolate a pen to its own chart:
-
-
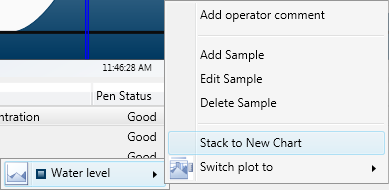
Right-click the pen in the legend, expand its menu, and click Stack to new Chart. The pen opens in its own chart.
Click
here to see the right-click menu. -
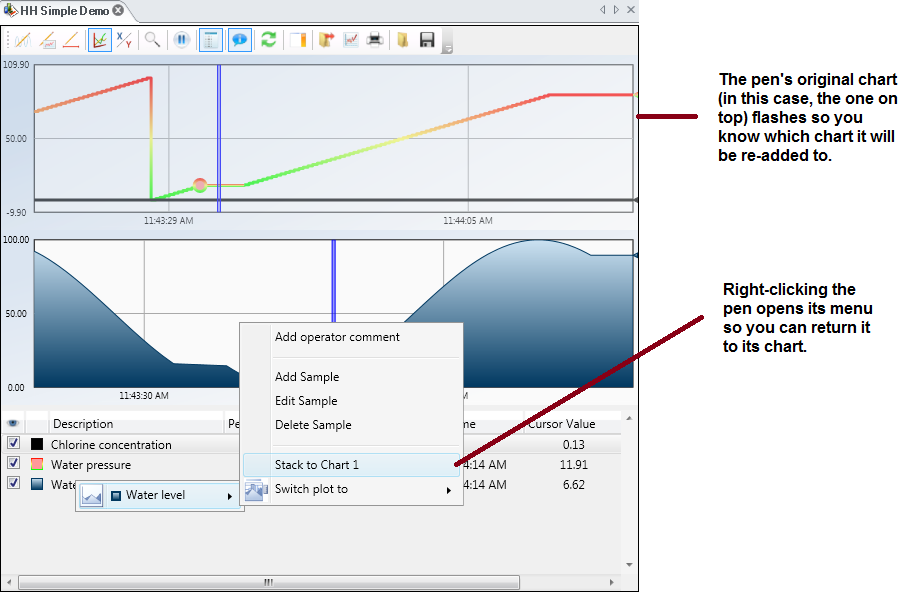
To re-add the pen to its original chart, right-click the pen in the legend, expand its menu, then click the chart you want to return it to.
Click
here to see an example.
-
-
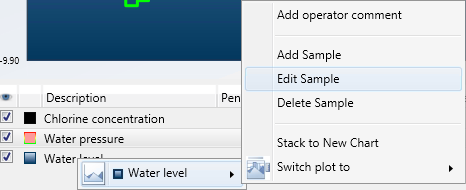
Change thetype of plot for the pen: Right-click the pen in the legend, expand its menu, click Switch Plot To, then click the type of plot you want for the pen.
If you are using a historical pen (a pen that has an HDA connection and a (raw data) Aggregate type), you can access several additional options. See the Pen Options for Trends topic for guidelines on configuring a pen with these settings.
-
-
If the legend is not visible, click the Legend button on the runtime toolbar or click the Legend button in the Trend Layout group on the TrendWorX64 Runtimeribbon to display the legend.
-
In the legend, right-click the pen to which you wish to add an operator comment.
-
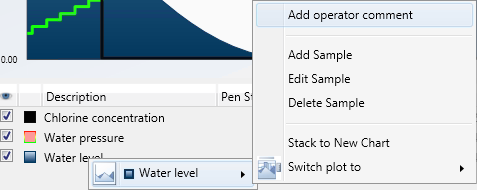
Expand the pen's menu and select Add operator comment.
Click
here to see how to access this option. The
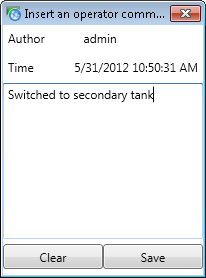
Insert an operator comment
dialog box appears. -
In the box underneath the timestamp, enter the comment you wish to make for the pen. The comment appears next to the current cursor location and includes your username and the time at which you opened the dialog box.
Click
here to see an example. -
Click the Savebutton when you are satisfied with the comment you have entered. You can also click theClearbutton if you wish to erase the comment.
-
-
Add a data sample value to a historical pen:
-
-
Enter Freeze mode or click the Real-time button in the Data Analysis group on the TrendWorX64 Runtime ribbon to display the runtime cursor.
-
Move the cursor in the chart to the time at which you wish to record a new data sample value.
-
If the legend is not visible, click the Legend button on the runtime toolbar or click the Legend button in the Trend Layout group on the TrendWorX64 Runtime ribbon to display the legend.
-
In the legend, right-click the pen to which you wish to add a data sample value.
-
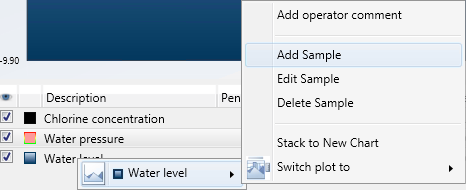
Expand the pen's menu and select Add Sample.
Click
here to see how to access this option. The
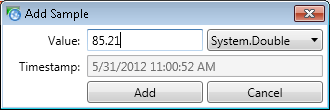
Add Sampledialog box
appears. -
Enter a value in the box and select a data type from the pulldown list. The value includes the time at the cursor location.
Click
here to see an example. -
Click the Add button to create the data value for the pen at the given time.
-
Click the
Close
button to exit the Add Sample dialog
box.
to exit the Add Sample dialog
box.
-
-
Edit a data sample value for a historical pen:
-
-
Enter Freeze mode or click the Real-time button in the Data Analysis group on the TrendWorX64 Runtime ribbon to display the runtime cursor.
-
Move the cursor in the chart to the time at which the data sample value you wish to change was originally collected.
-
If the legend is not visible, click the Legend button on the runtime toolbar or click the Legend button in the Trend Layout group on the TrendWorX64 Runtime ribbon to display the legend.
-
In the legend, right-click the pen in which you wish to edit an existing data sample value.
-
Expand the pen's menu and select Edit Sample.
Click
here to see how to access this option. The
Edit Sampledialog box
appears. -
Change the value in the box and/or select a different data type from the pulldown list. The value includes the time at the cursor location.
Click here
to see an example. -
Click the Modify button to change the data value for the pen at the given time.
-
Click the
Close
button
to exit the Edit Sample dialog box.
-
-
Remove a data sample value from a historical pen:
-
-
Enter Freeze mode or click the Real-time button in the Data Analysis group on the TrendWorX64 Runtime ribbon to display the runtime cursor.
-
Move the cursor in the chart to the time at which the data sample value you wish to remove was originally collected.
-
If the legend is not visible, click the Legend button on the runtime toolbar or click the Legend button in the Trend Layout group on the TrendWorX64 Runtime ribbon to display the legend.
-
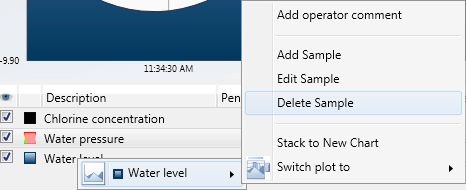
In the legend, right-click the pen from which you wish to remove an existing data sample value.
-
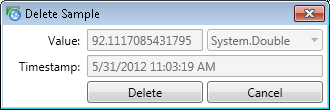
Expand the pen's menu and select Delete Sample.
Click
here to see how to access this option. The
Delete Sample dialog box appears, displaying the value and data
type to remove as well as the time at the cursor location. Click
here to see an example. -
Click the Delete button to remove the data value from the pen at the given time.
-
Click the
Close
button
to exit the Delete Sample dialog box.
-

The following is a list of columns that can appear in the legend. These fields are enabled when the chart is configured, as described in Chart Options for Trends. All possible fields are listed below.
-
Alarm: This field enables/disables drawing of limit lines configured for a specific pen.
-
Tag: Shows the current data source of the pen.
-
Cursor Value 2/Cursor Time 2: These two fields indicate the current position and current time of the second cursor. To make this second cursor appear, select the Two cursors option in Cursor section of the Data Analysis group on the TrendWorX64 Runtime ribbon.
-
Value Difference: Shows the difference in values that the pen recorded at the two cursor locations (displays "N/A" if no second cursor appears).
-
Time Difference: Shows the difference in time between the two cursor locations (displays "00:00:00" if no second cursor appears or if the two cursors have the same cursor time).
-
Low Range/High Range: These two field show the lowest and highest range values for the pen.
-
Low Low Limit/Low Limit/High Limit/High High Limit: These four fields show the low low, low, high, and high high boundaries for values that pen will write to the chart.
-
Filter: Shows the type of filter being applied to the pen.
-
Units:Shows the units of measure assigned to the values that the pen is writing to the chart.
-
Sample Count: Shows the number of data points collected in the chart.
-
Minimum/Maximum: These two fields show the minimum and maximum values that the pen has written within the trend period currently displayed in the chart.
-
Average: Shows the average value that the pen has written within the trend period currently displayed in the chart.
-
Standard Deviation: Shows the standard deviation of the values that the pen has written within the trend period currently displayed in the chart.
-
Total: Shows the sum of a pen's good sample values within the trend period currently displayed in the chart.
-
Visibility: Lets runtime users make a pen visible or hidden by enabling/disabling the Visible check box next to the pen name.
-
Colors: Shows current color assignment. This can be modified in the pen properties using the Edit Pen button at runtime.
-
Description: Shows the pen's name or the value of any aliases that have been assigned to the pen. Runtime users can modify this description in the pen properties using the Edit Pen button.
-
Pen Status: Shows whether the pen's source is "Good" or not, letting runtime users know if the source becomes unavailable for some reason.
-
Cursor Value/Cursor Time: These two fields indicate the current position and current time of the cursor. To move the cursor at runtime, click where you want the cursor to appear or click the Go To Time button and set the time there.
-
Last Value/Last Value Time: These two fields indicate the value of the last data point and its collection time for the pen. They both update at the same time, which is the refresh rate.
See also: