Adding a Treemap Control
A Treemap Control offers a way to visualize a dataset as a series of rectangles scaled proportionally to a value in the dataset. Example uses could include:
-
Comparing total running hours on machinery in the past month
-
Viewing the relative magnitude of fault counts, organized by type of fault
-
Listing downtime event reasons for a machine, and scaling the area according to total accrued downtime
The Treemap Control is designed to receive input data in a dataset format. This is most often derived from Database connections or BI Server data models. If you have a dataset with a numeric value column, you can use a treemap to visualize it.
To create and configure a Treemap Control
-
On the Controls ribbon, select Treemap Control
 , and then drag the mouse diagonally across the canvas to make a rectangle for inserting the viewer.
 -
On the Treemap ribbon, select Configure.
-
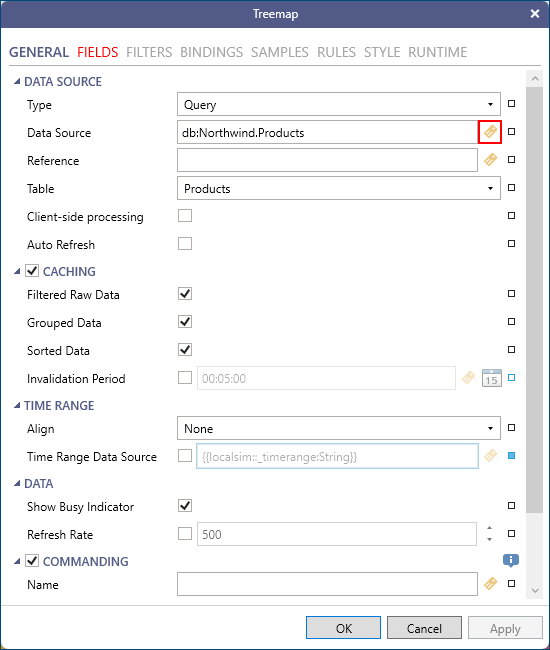
Select the tag icon in the configurator for the Data Source and browse to Data Connectivity > Databases > SQL Server > Northwind > Products and click OK.
-
Select the Fields tab in the configurator and then click the refresh button:
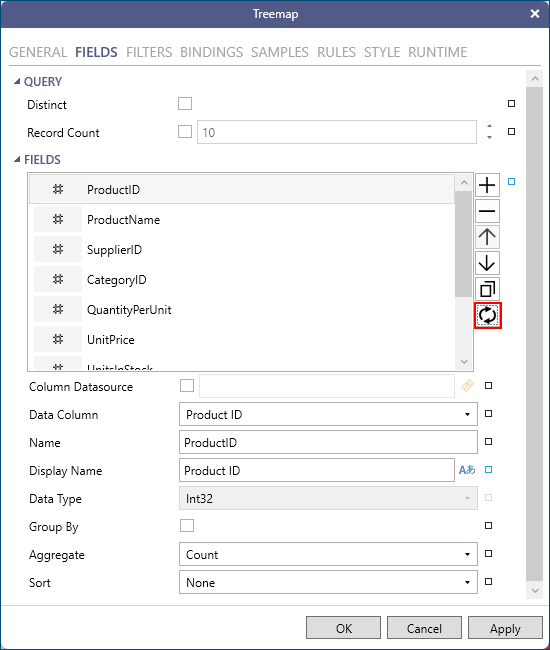
This will query the data source and update the fields from the dataset that are available in the control.
-
Select the Bindings tab and then update the bindings:
-
Set the Category Binding to ProductName
-
Set the Value Binding to UnitsInStock
-
-
Click OK to apply these changes and close the configurator.
-
erify the Treemap Control settings in runtime. Use the options on the upper right of the GraphWorX screen to switch to the runtime mode
 or to open the display in a web browser
  .
.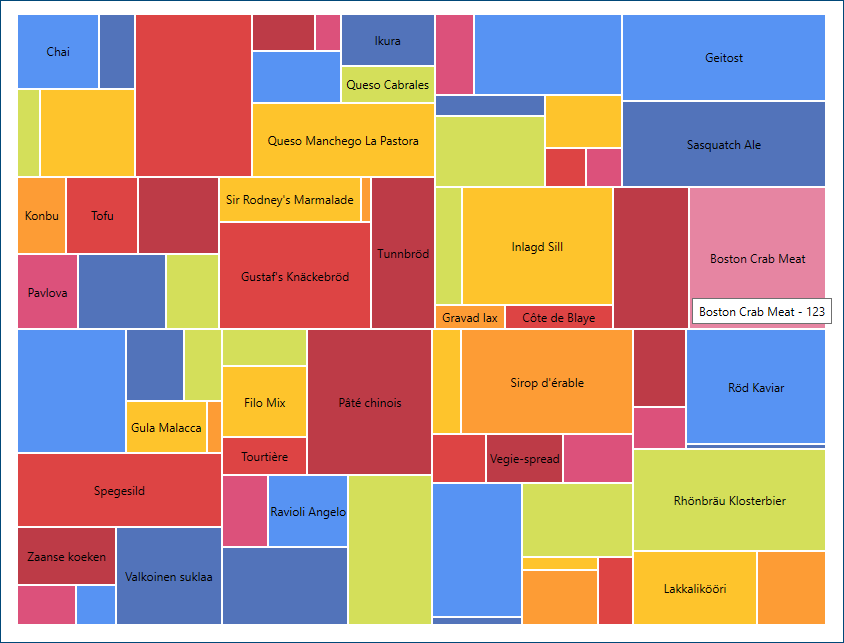
The result should be a control that creates a rectangle for each entry in the dataset, with the size corresponding to the magnitude of the value compared to the other values in the dataset. In this case, it is the Products from the Northwind database and the size of the rectangle represents the number of units in stock.