TraceWorX Configurator Settings

The TraceWorX Configurator is used to enable trace logging for specific GENESIS components and configure other settings regarding what should be logged.
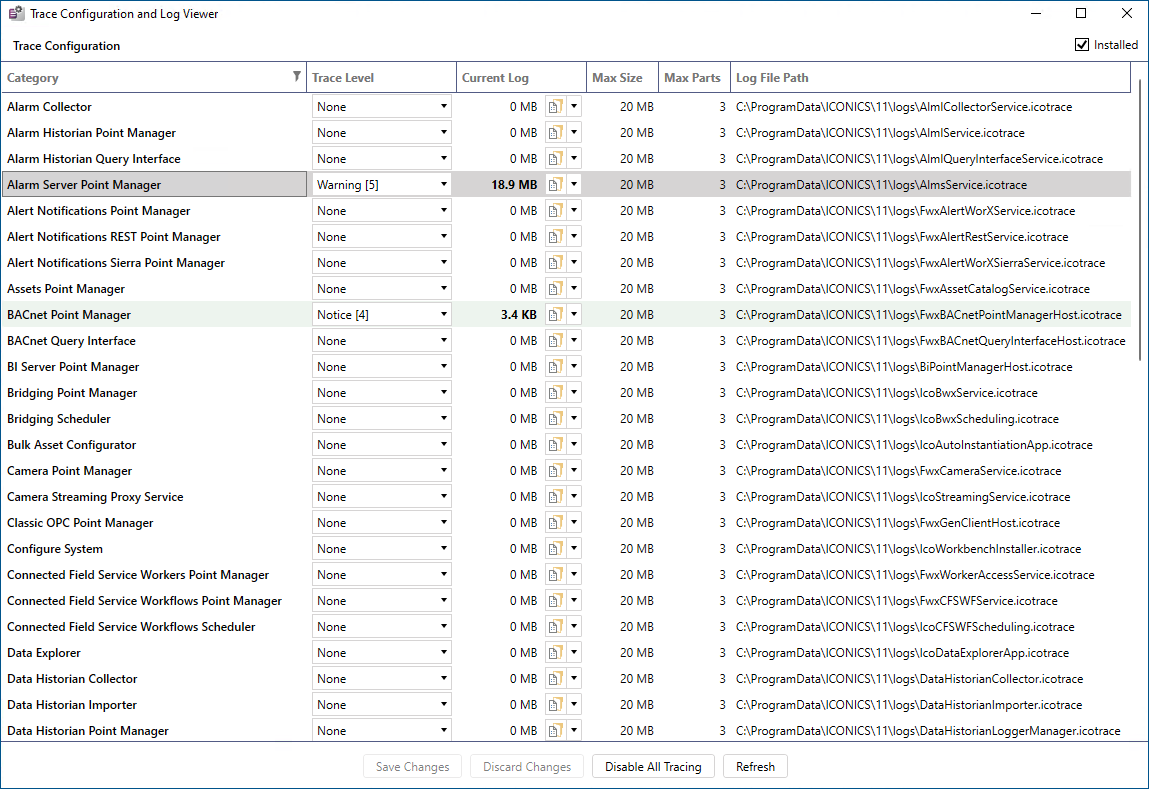
TraceWorX Configuration User Interface

You can configure the following settings.

Trace Option

Description

Module Name

Lists the available components (applications and services). You can enable tracing separately for each application/service. Typically, you would only enable tracing for the component(s) related to the functionality that you want to diagnose.

Trace Level

Determines the amount of diagnostic detail to log for the corresponding module. See Trace Levels for more information.

Module Filter

Specifies the components within an application that should be logged. See Module Filtering for more information.

Custom Filter

Specifies messages with a particular filter name that should or should not be logged. See Custom Filtering for more information.

Current Log

Shows the current size of the log file in megabytes. This button opens a drop-down menu with the following options:

  • View the log file in the TraceWorX Log Viewer.
  • Zip the log file.
  • Delete the log file.
  • Open the folder that contains the log file in Windows Explorer.

Max Log Size

Limits the file size of the log file to the specified number of megabytes. If a log file exceeds this value, an archive copy of the current log will be preserved and new empty log file will be started. You can specify a value of zero (0 MB) to allow the log file to grow indefinitely, but beware that logging at Debug, Debug Verbose, or All levels for extended periods of time could result in extremely large log files.

Log File Name

Specifies the folder and name for the file where diagnostic data will be written. By default, all trace logs are written to the same folder with a filename based on the name of the module being logged. You can use the button to browse for an alternative file location.

Buffer

When selected (set to On), trace messages are temporarily held in memory rather than being immediately written to disk and the trace log file remains open between trace events. When not selected (set to Off), data is immediately written to disk for each trace event and the log file is closed after the trace entry is written. Buffering can possibly improve the performance of trace logging (depending on the frequency/quantity of what is being logged), but if an application crashes, you could miss any trace messages that have not been written to disk yet. Generally, it is recommended to leave buffering on (default).

Configuration Refresh

Sets the frequency at which TraceWorX checks for configuration changes. For example, if GraphWorX is already running and you change the trace level for GraphWorX, if the configuration refresh is 60, it could take up to one minute (or less) for the change to take effect. Faster refresh rates will make applications respond more quickly to TraceWorX configuration changes, but can slow the system down due to the extra overhead of having to the check the configuration for changes more often. If you do change this setting to a value less than 60, it is recommended to return this setting back to 60 when you have finished tracing the corresponding module. It is important to remember that this is the rate at which it checks for any TraceWorX configuration change, even enabling/disable tracing. So even when all TraceWorX modules are set to Level=None, the modules set at a refresh rate of 10 would be re-reading their configurations every 10 seconds to see if tracing has been turned on. The default value of 60 was chosen to have negligible impact on a running system when TraceWorX is not being used.