Using Trace Viewer
After you start logging TraceWorX messages, you can view saved trace log files in Trace Viewer.
To view a specific trace log, do one of the following:
-
Open the TraceWorX Log Viewer component in GENESIS Tools using the Windows Start menu, and then click
 on the top ribbon to select the desired log file(s).
This adds the selected log to any log messages that might be already displayed in the viewer. To change the view, expand the drop-down list next to the button and select Open and discard previous.
-
In TraceWorX Configurator in the Current Log column, click
in the field corresponding to the desired component (category).
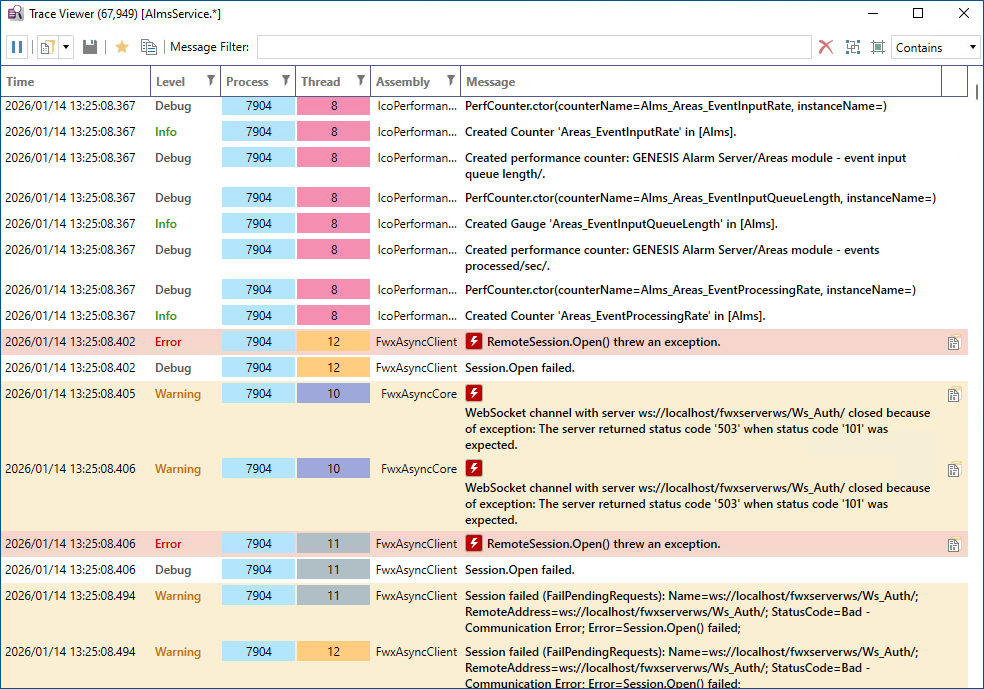
By default, the Trace Viewer displays the following information.
|
Column |
Description |
|---|---|
|
Time |
The time and date when this trace event occurred. |
|
Level |
The trace level associated with the message. This indicates the type of the trace message, such as an error, a warning, or a debug message. Learn more |
|
Process |
Numeric identifier of the process (PID) of the component/service instance that generated this trace message. For example, if you are running two instances of GraphWorX, you will see messages with two different PIDs in the GraphWorX trace log. The column is color-coded, so you can easily distinguish which messages came from a particular component instance. |
|
Thread |
Numeric identifier of the thread that generated this trace message. A component may have multiple threads running simultaneously. The column is color-coded, so you can easily distinguish which messages came from a particular thread. |
|
Assembly |
The full .NET identification of the DLL in which the event occurred. |
|
Message |
The text description of the event. This helps you understand what was happening at that moment in the execution of the component. |
Working with the Trace Viewer UI
The top ribbon includes filtering and highlighting options described in the following sections, a button for opening log files, and other useful options.
-
 for pausing the data collection while you inspect the log. The button image changes, and the refresh button
  is added. To resume logging, click the button again.
 -
 for exporting the displayed log or its parts. It opens an export dialog with detailed settings for the file's content, format, and location.
Since you can open multiple log files in a single view, the export option lets you combine selected logs into a single file.
-
 for marking selected rows. The marked entries turn black, and you can search through them using F7 and Shift+F7.
By right-clicking anywhere in the list of trace messages, you can display a more detailed menu with some additional settings, such as the following:
-
 Clear view for removing all entries from the view. (The button on the top ribbon only clears the message filter.)
 -
Auto-scroll to end for moving to the end of the log when you start scrolling, which can be useful when working with very long lists.
-
Columns for customizing the view by adding or hiding columns listed in the drop-down list.
Filtering Messages in Trace Viewer
Since a TraceWorX log can contain a large number of trace messages, you can use filters to hide messages that are not relevant to the issue that you are diagnosing.
Trace Viewer includes the following filtering options:
-
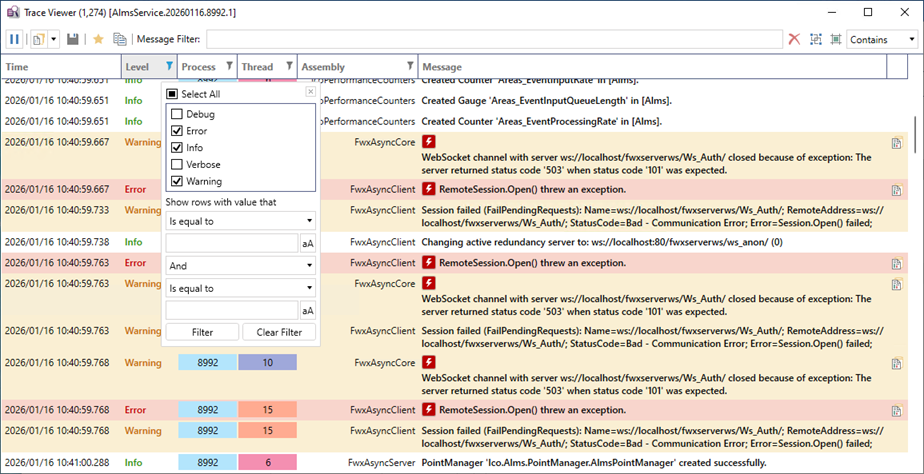
Column filters: Filter messages by data contained in the specified column.
Click
 in the desired column header to open the filtering options. You can filter messages by severity (in the Level column), process or thread number, or assembly name.
When a filter is applied, it is indicated by a different color of the filter button.
-
Message filter: Filters messages by a specified text.
To apply the text filter:
-
Enter the desired text in the Message Filter text box on the top ribbon.

-
In the drop-down list on the right, select one of the following options.
Option
Description
Contains
Default; displays messages that contain the exact text.
Wildcard
Adds placeholder characters to the specified text:
- Asterisk (*)—Matches any text.
- Question mark (?)—Matches any single character.
Regex
Displays messages defined by a regular expression.
-
Optionally, you can click
 to revert the filter and display only messages that do not include the specified text.
 -
To clear the text filter, click
.
-
Highlighting Messages in Trace Viewer
When analyzing trace log files, it may be desirable to quickly find certain messages within the log. Highlighting allows you to visually mark messages that contain the specified text, so that you can easily identify them in the overall sequence of events.
To highlight a message, click  on the top ribbon to switch to highlighting mode, and then enter the desired text in the Message Filter textbox. To add a wildcard, use an expression, or highlight the messages that do not include the specified text, use the same settings as for filtering.