Visualizing Data in Data Explorer
This topic describes using the Data Explorer control to visualize various types of data in real time. While the procedure and images use sample asset tags and local simulation data, the steps will help you navigate and visualize your own data in Data Explorer.
Note: Ensure that the GENESIS Data Historian Point Manager service is running prior to attempting to view historical data. You can do so by starting the service from the System Services menu on your machine. When in the Workbench, if you have the Historical Data>Data Historian module selected on the left side of the display, you can view the state of the service by selecting the Project Explorer tab (top left corner of the display) and looking toward the stoplight that is now visible in the toolbar. Green indicates that the service is running, yellow indicates that the service is starting, red indicates that the service is stopped. Left-click on the stoplight to swap the state of the service from on to off, or vice versa.
To visualize data in Data Explorer:
- Open Data Explorer in GraphWorX or as a stand-alone utility. Learn more
- In the left pane, expand the desired folder, for example: Assets > Company > Foxboro bakery > North > Baking line > Ingredients mixing tank > Ingredient charger > Heating control.
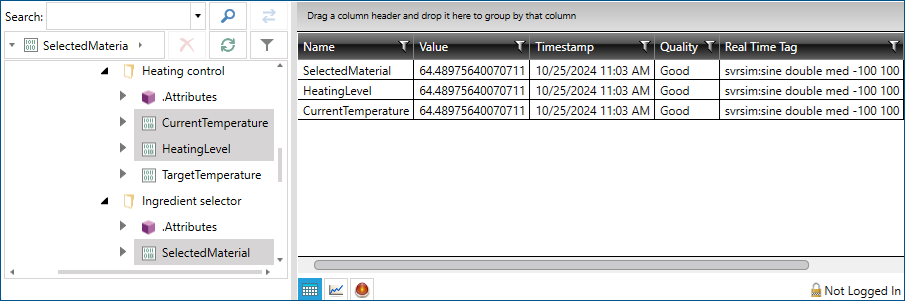
- Select the desired tag, such as CurrentTemperature. The data associated with the tag appears in a grid view in the main pane.
-
To view multiple tags simultaneously, do one of the following:
- Hold the Ctrl key and select any additional tags.
- Hold the Shift key to select the last item of a range of tags to display.
- Select a folder such as Heating control to view all tags in that folder and its sub-folders.
 To refresh, filter, or export the data displayed in the grid view, right click anywhere in the main pane and select the desired option.
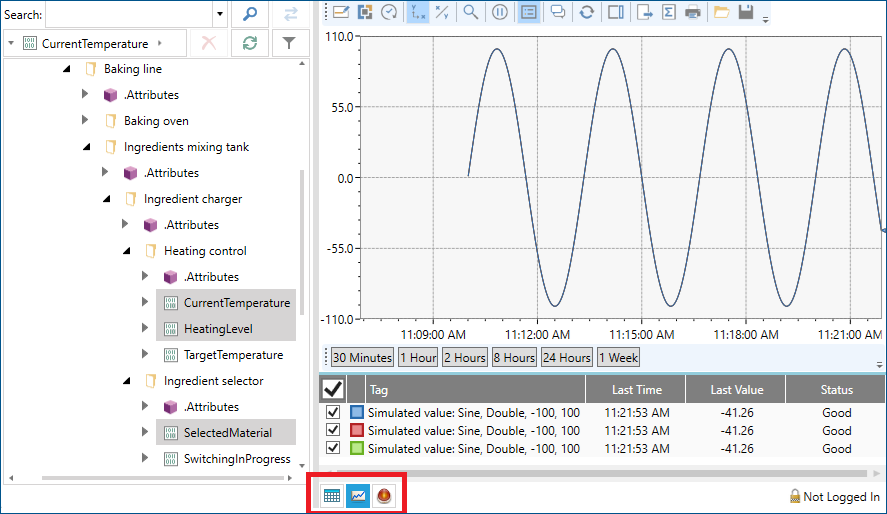
 - While the grid view effectively communicates information about the tags themselves, a graph is better suited to visualizing their numerical data. To switch to the trend view of the selected data, simply select the small trend view button at the bottom left corner of the grid area as highlighted in the red rectangle below. The data will begin plotting automatically. Many data sources have more than one possible visualization mechanism, and any available visualization options for the selection of tags will be available here. For more information on data source types and their default visualization mechanisms, refer to Introduction to the Data Explorer.
-
Double click the chart area to display the configuration settings and edit them as desired.
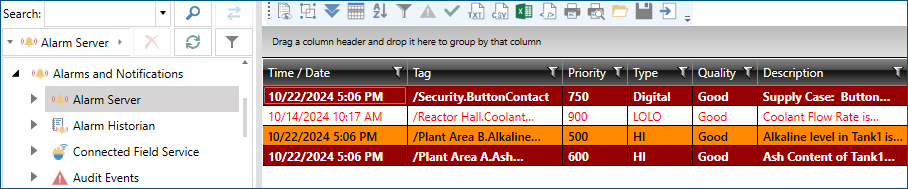
- Data Explorer also allows you to view active alarms for a given asset. To display the active alarms for an asset you have configured, select the small Alarm View button at the bottom left corner of the grid area, next to the trend view button from the previous step. To see the Data Explorer's alarm view in action, select Alarms and Notifications > Alarm Server. All currently active alarms for your project are displayed in the main pane.
Note: The Data Explorer alarm view functions in much of the same way as a regular Alarm Viewer in GraphWorX runtime. Double clicking the alarm area brings up a menu bar that allows you to interact with any alarms in a similar way to an Alarm Viewer control.
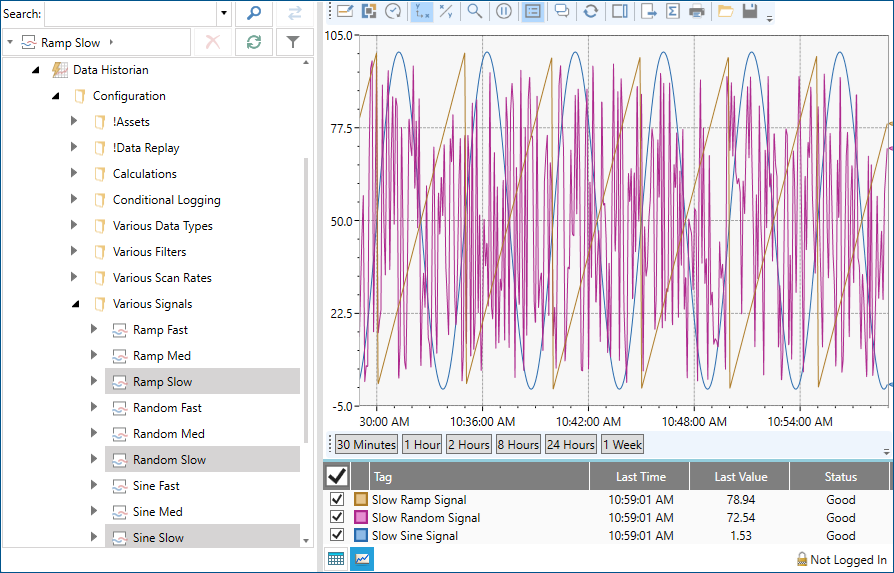
- You can also use Data Explorer for viewing historical trend data from HDA (Historical Data Access) tags or HAE (Historical Alarm and Event) tags. For example, with the Data Historian point manager running, navigate to Historical Data > Data Historian > Various Signals and select one or more of the available tags. Data Explorer displays charts representative of historical data correlating with the selected tags.