Introduction to Data Explorer
The Data Explorer tool lets you quickly discover, browse, and view information across your entire GENESIS system without needing to configure any HMI screens or dashboards.
You can access it as a stand-alone utility or as a part of GraphWorX. Learn more
Data Explorer combines the GENESIS Data Browser component with optimally selected views of system values for various data types:
- Real-time data
- Database data
- Historical data
- Alarms
- Schedules
- Assets
- BACnet
Default Views
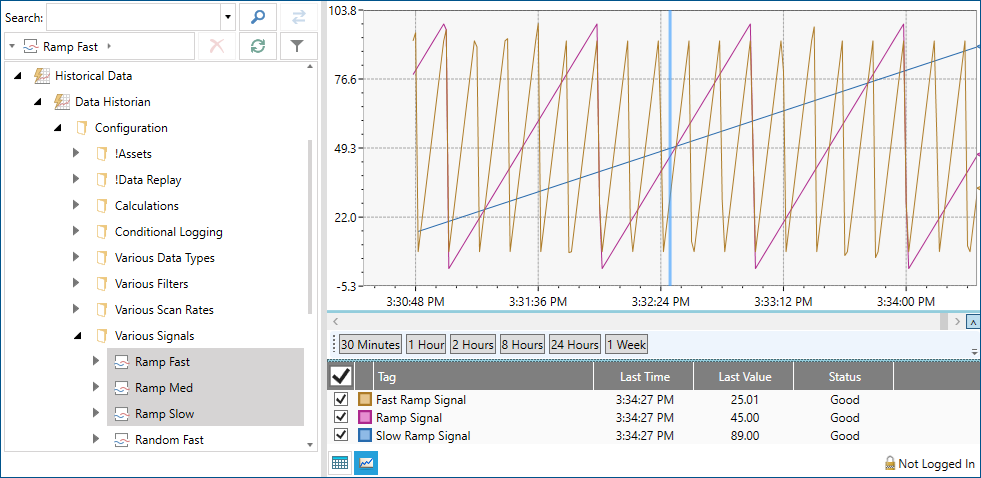
As you browse data sources, Data Explorer automatically chooses an appropriate default view for the selected data source(s). For example, if you select one or more historical data access (HDA) tags, Data Explorer displays a trend view plotting the historical values of those data sources.
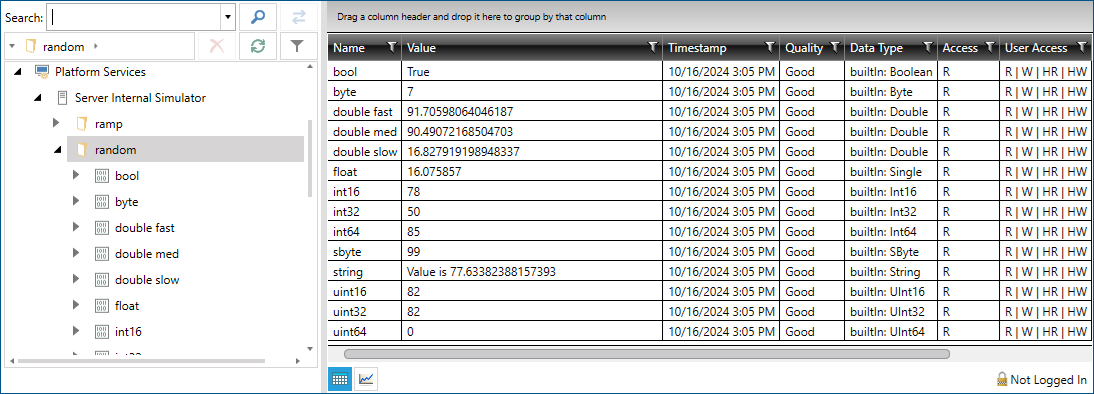
If you select a folder rather than an individual tag, Data Explorer displays a view for all child tags of that folder. If the selected folder contains a large number of tags, Data Explorer may use paging to let you to switch between subsets of the folder's child tags. For example, if you select a folder containing data access (DA) tags, a grid view for all data sources contained in that folder is displayed.
The table shows the default views for various types of data sources:
|
Data Source Type |
Default View |
|---|---|
|
Data Access (DA) tags |
Grid view of live real-time values |
|
Database tags |
Grid view |
|
Historical Data Access (HDA) tags |
Trend view |
|
Alarm & Event (AE) or Historical Alarm & Event (HAE) tags |
Alarm view |
|
Schedule tags |
Schedule view |
|
Asset tags |
Asset-optimized grid view |
|
BACnet tags |
BACnet view |
Alternative Views
Although Data Explorer uses a default view based on the tag type, some tags may support multiple ways to view the data. For example, you can view values of DA and HDA tags either in a grid or in a trend graph. When alternative views such as grid and trend views are available, Data Explorer provides buttons to easily switch between those views.

What's Next?