Logging Data from an MQTT Broker
Values arriving from an MQTT broker are live only: a subscriber connection exposes the most recent message it received, nothing older. To keep a history of that data, log the subscribed points with Data Historian in the same way you would log any other real-time source in GENESIS.
Before you begin, subscribe to data from an MQTT broker and confirm in Data Explorer that the points you want are receiving values. A point that has never received a message cannot be browsed.
This procedure logs the values as GENESIS receives them, timestamped on arrival. Values that a device published while the subscriber connection was down are not recovered afterward, so you must match the Data Historian collection rate to how often the device actually publishes.
To log data from an MQTT broker:
-
Open Data Explorer, expand My Computer > Internet of Things > your subscriber connection, and note the address of the points you want to log. Subscribed points are addressed as
iot:<connection>/<device>/<tag>. -
Open Workbench. In the Project Explorer, expand your project > Historical Data > Data Historian, right-click Logged Data or a folder within it, and select Add Tag.
-
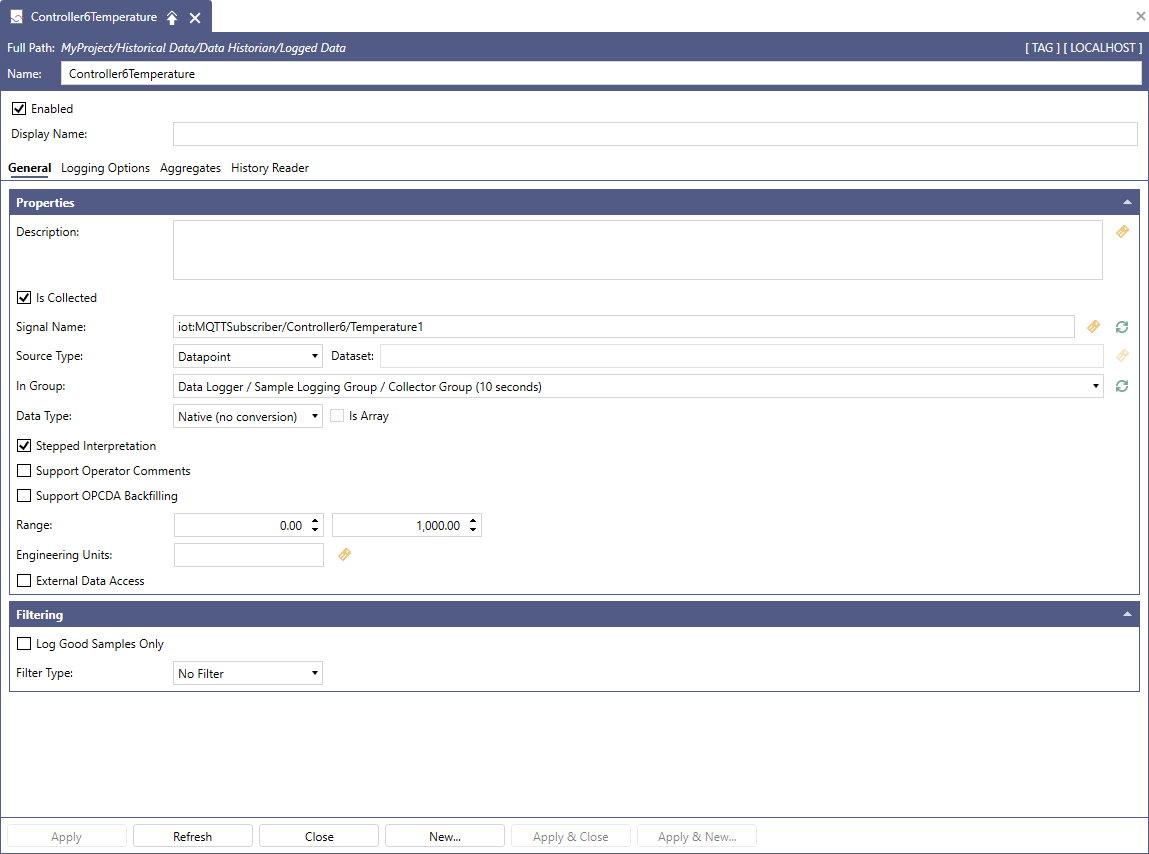
In the new tag configuration dialog, enter a Name for the tag.
-
In Data Source, browse for the subscribed point or enter its
iot:address directly.To log multiple points at once, right-click Logged Data and select Add multiple tags.... Then, browse to the subscriber connection and select the desired points.
-
In In Group, select an appropriate logger and collector group that is suitable for the publish rate of the data point.
-
Click Apply & Close, and then confirm that the Data Historian Logger service is running. With Data Historian selected in the Project Explorer, ensure the traffic light for the logger on the Home ribbon is green.
-
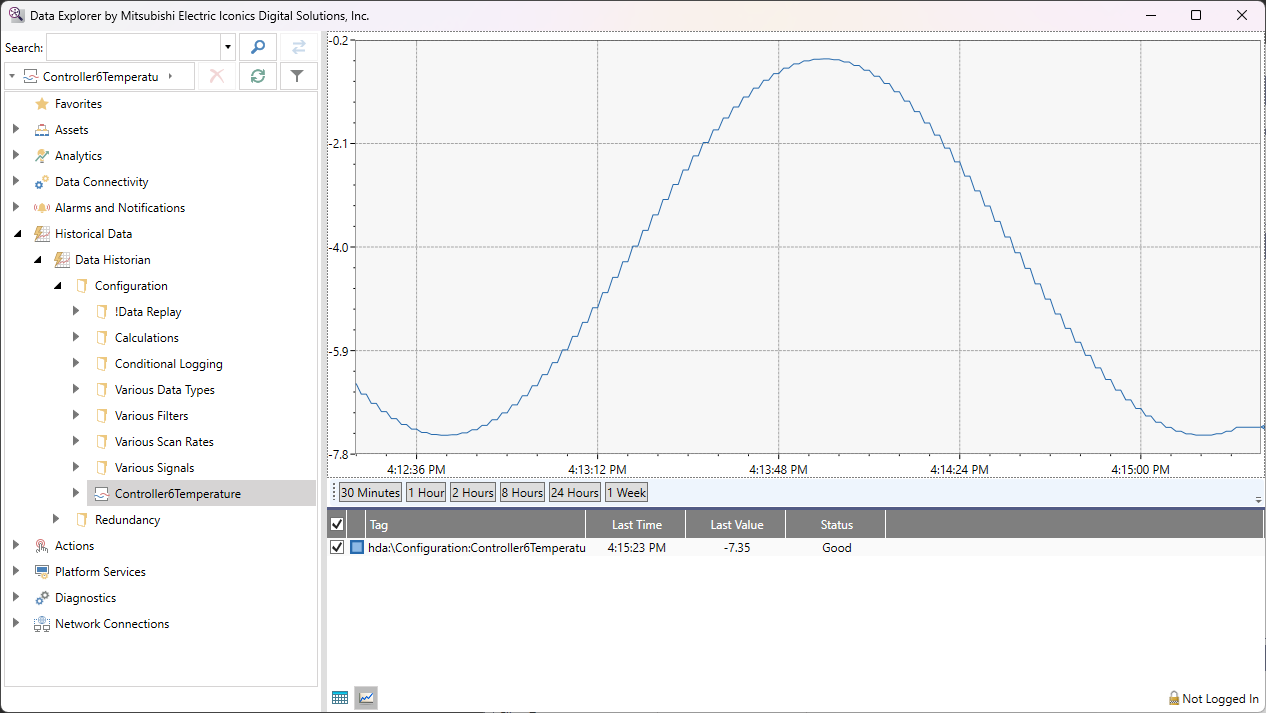
Confirm the data is being captured. In Data Explorer, expand Historical Data > Data Historian and select the new tag. Data Explorer opens a trend view, and the values accumulate at the rate the device publishes.