Chart and Axis Tab
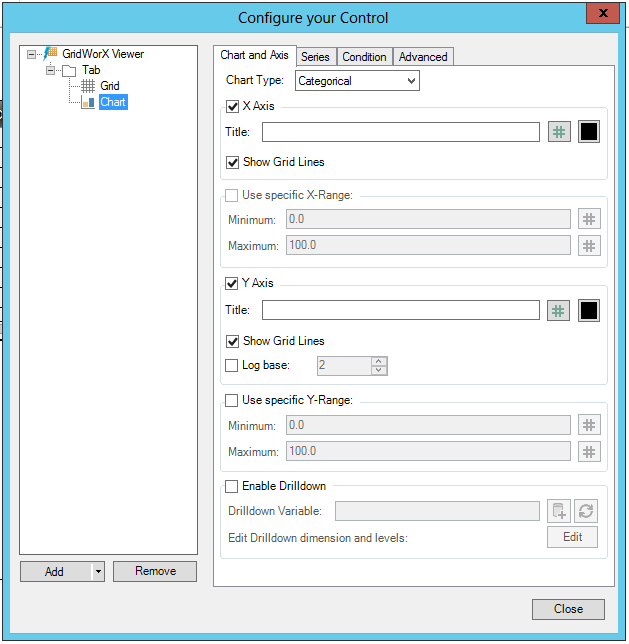
The Chart and Axis Tab allows you to set the Chart Type, then configure the chart properties.
A GridWorX Chart's Chart and Axis Tab
-
Chart Type - Use the pulldown menu to select from either Categorical, Scatter, Pie, Donut, Polar,
 Date
Time, SPC
Histogram or SPC Line.
Date
Time, SPC
Histogram or SPC Line.
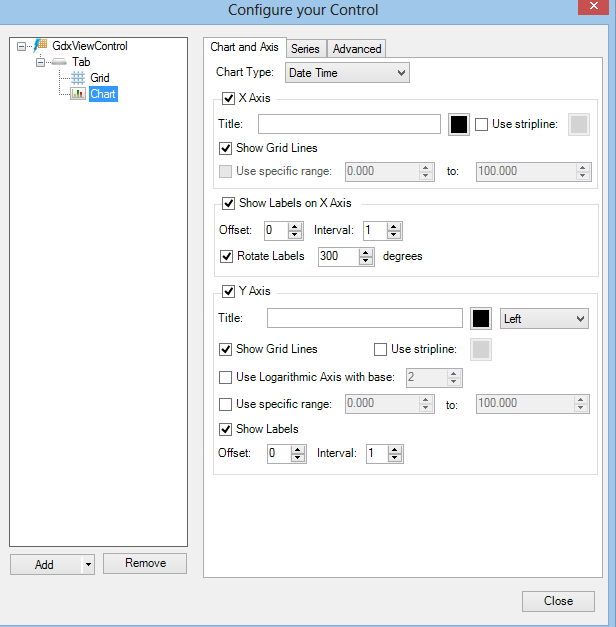
You can then decide to update settings for the X-Axis or Y-Axis of the chart. Clicking on the checkbox to the left of either 'X-Axis' or 'Y-Axis' allows you to make the following changes:
-
Title - Enter a title for the specified axis. Click on the colored square to the right of the text entry field to select a color option (solid/gradient/image).
-
Use stripline - Click this checkbox to employ striplines (horizontal or vertical ranges that shade the background of the chart in regular or custom intervals) for the specified axis. Click on the colored square to the right to select a color option (solid/gradient/image).
-
Show Grid lines - Click to use grid lines for the specified axis.
-
Use specific (X- or Y-) range - Based on the selected Chart Type, you can decide for what range these settings will affect. You will be able to enter the Minimum or Maximum ranges in the text entry field or click on the # buttons to open the Data Browser and navigate to your specific range data.
-
Show Labels on X-Axis - Click this checkbox to show/hide labels on the X Axis.
-
Use specific range - Click this checkbox in order to explicitly specify a range for the Y Axis. One selected you can enter the range in the two text entry fields to the right.
-
Show Labels - Click this checkbox to show/hide labels on the Y Axis.
-
Offset - Once the 'Show Labels on X Axis' checkbox is selected, you can set the amount of room to offset the Labels either by entering a number in the text entry field or by using the up/down arrows.
-
Interval - Once the 'Show Labels on X Axis' checkbox is selected, you can set the interval of Labels either by entering a number in the text entry field or using the up/down arrows.
-
Rotate Labels - Once the 'Show Labels on X Axis' checkbox is selected, you can click this checkbox to allow for rotation of the labels. Once selected, you can set the degrees of rotation by entering a number in the nearby text entry field or by using the up/down arrows.
-
Use Logarithmic Axis with base - Click this checkbox in order to use logarithmic values on the Y Axis. Once selected, you can enter a number for the logarithmic base in the nearby text entry field or use the up/down buttons.
-
Enable Drilldown - Use this checkbox to enable or disable drilldown capabilities within the chart.
-
Drilldown Variable - Enter the drilldown variable in the text entry field or click on the
 button to open the Data Browser to navigate
to your selected drilldown variable. You can also click on the
button to open the Data Browser to navigate
to your selected drilldown variable. You can also click on the  to reset the list
of drilldown dimensions.
to reset the list
of drilldown dimensions. -
Edit Drilldown dimension and levels - Clicking the Edit button opens the BI Drilldown Chart Configuration window. Edit your settings here then click on the Close button to return to the Chart and Axis tab properties.
See Also: