Runtime Use Report Wizard
The Runtime Use Report Wizard is part of ProjectWorX in the Workbench. See 'About ProjectWorX' for background information on ProjectWorX and Runtime Use Reports.
The Runtime Use Report is more complex than the Configured Tag Report. Three independent tasks are created (Creating Report, Tag Collection, Validation). All the tasks are optional, but at least one task must be selected. It’s also possible to create each task without the wizard, using the menu in the task panel.
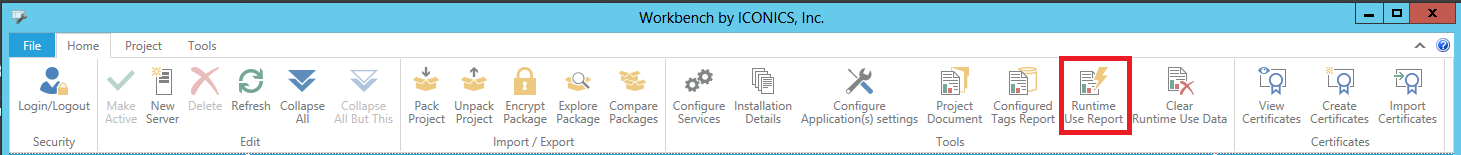
The tool itself can be found in the Tools section of the Home ribbon in the Workbench, as shown below.
Runtime Use Report Button in the Tools Section of the Home Ribbon in the Workbench
To Open the Runtime Use Report Wizard:
-
Click on the Runtime Use Report button in the Tools section of the Home ribbon in the Workbench.
Runtime Use Report Button

-
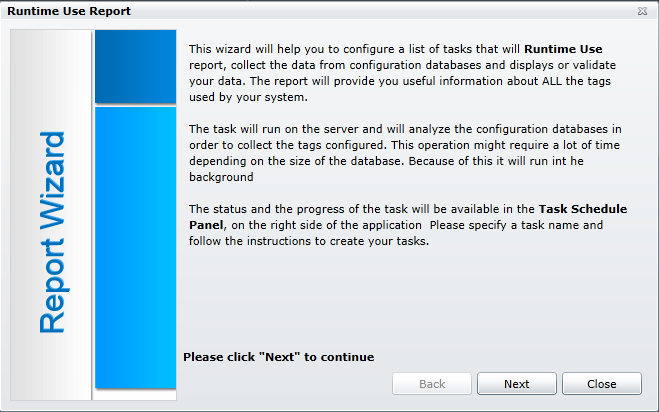
This opens the first screen of the Runtime Use Report Wizard window, as shown below. Upon first use, you can read through the description of the wizard. Click Next to continue.
Runtime Use Report Wizard First Screen
-
This opens the General Settings section of the Runtime Use Report Wizard, as shown below.
General Settings of the Runtime Use Report Wizard
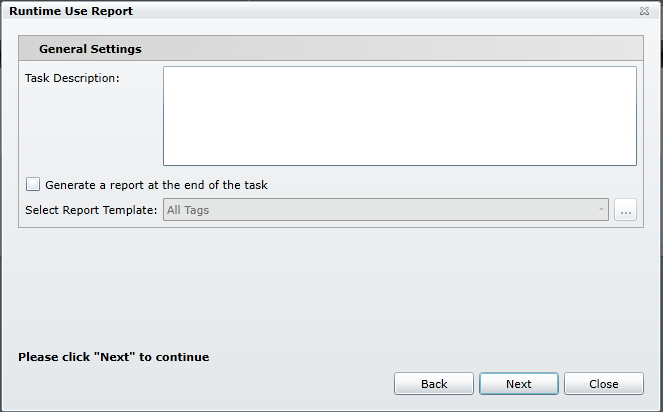
The General Settings properties include:
-
Task Description- Enter a description for this immediate task in the text entry field.
-
Generate a report at the end of the task - Click this checkbox if you wish to automatically generate a report after running the wizard. Selecting this option activates the Select Report Template option.
-
Select Report Template - (Activated by the Generate a report at the end of the task checkbox). Use the pulldown menu to select from existing report templates (including 'All Tags'). Or, you can click on the ellipsis button [...] to open a file browser to navigate to any other existing report template (.rdl) file.
Once you have made your selections here, click Next to continue. In each successive step, you may also click the Back button to change any previously made settings.
-
This opens the following screen in the Runtime Use Report Wizard.
Select Active Configurations
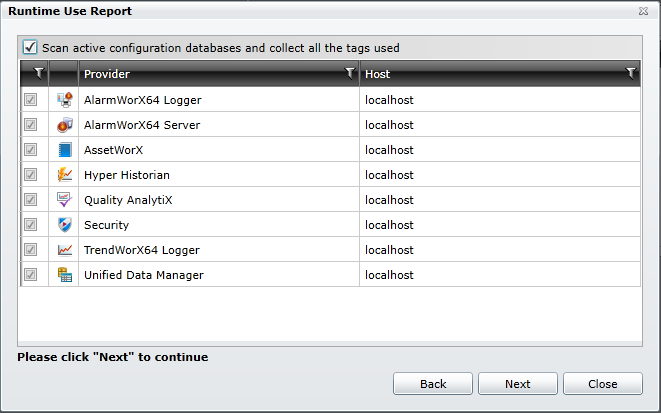
The configurations listed may differ, depending on the template you selected in Step 3. This optional step allows you to select the providers in the Workbench to be analyzed. You can choose to click on the Scan active configuration databases and collect all the tags used checkbox. This will allow you to click on the checkbox(es) to the left of the active configurations you wish to be used to generate the Runtime Use Report. Once you have completed this step, click on the Next button.
-
This opens the following screen in the Usage Report Wizard.
Scan Display and Collect All the Tags Used
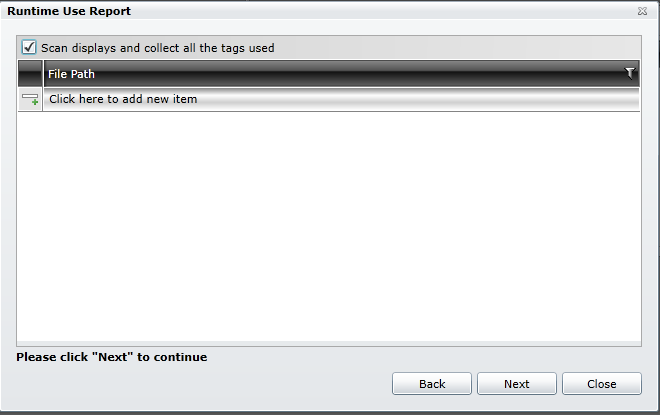
This optional step allows you to select objects (alarm configurations, trend configurations, grid configurations, displays) to be analyzed. All formats (Windows Presentation Foundation [WPF], Silverlight, Windows RT) are supported.
You can choose to click on the Scan displays and collect all the tags used checkbox. This will activate the File Path section below. Clicking on the Add button [![]() ] allows you to configure a path to your selected display file. You can enter the path directly in the text entry field or you can click on the ellipsis [...] button, which opens a file browser, allowing you to navigate to your selected display file. Once selected, the path will show in the File Path section of the window. Once you have added your selected display files, click Next to continue.
] allows you to configure a path to your selected display file. You can enter the path directly in the text entry field or you can click on the ellipsis [...] button, which opens a file browser, allowing you to navigate to your selected display file. Once selected, the path will show in the File Path section of the window. Once you have added your selected display files, click Next to continue.
-
This opens the following screen in the Runtime Use Report Wizard.
Validate Collected Tags
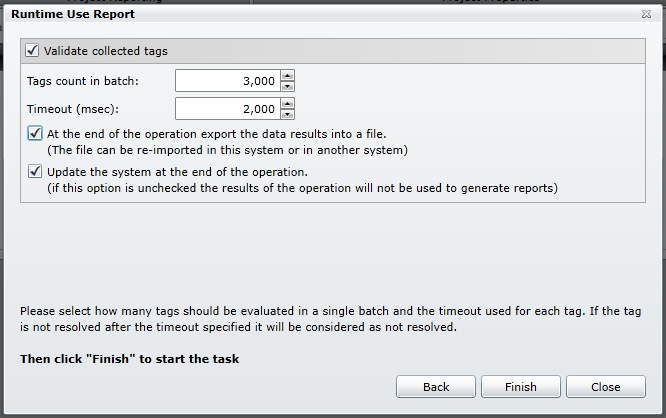
Clicking the Validate collected tags checkbox activates the remainder of the settings, including:
-
Tags count in batch: - Enter your desired number of tag counts in the batch to be validated in the text entry field directly or use the up/down arrows.
-
Timeout (msec): - Enter your desired duration for timeout (in miliseconds) in the text entry field directly or use the up/down arrows.
-
At the end of the operation export the data results into a file - Click this checkbox if you want the validation results to be included in a file following operation of the Runtime Use Report Wizard. The file can be re-imported in the same system or into another system.
-
Update the system at the end of the operation - Click this checkbox if, following this tag validation, you would like the system to be updated. If not, the results of the operation will not be used to generate reports.
When you have completed your settings, click Finish to proceed.
-
The Runtime Use Report Wizard then proceeds to create your requested report. Reports are generated asynchronously on the server. You will see the report's status appear in the Task Panel on the right side of the Workbench, as highlighted below.
Report Status Listed in the Task Panel in the Workbench
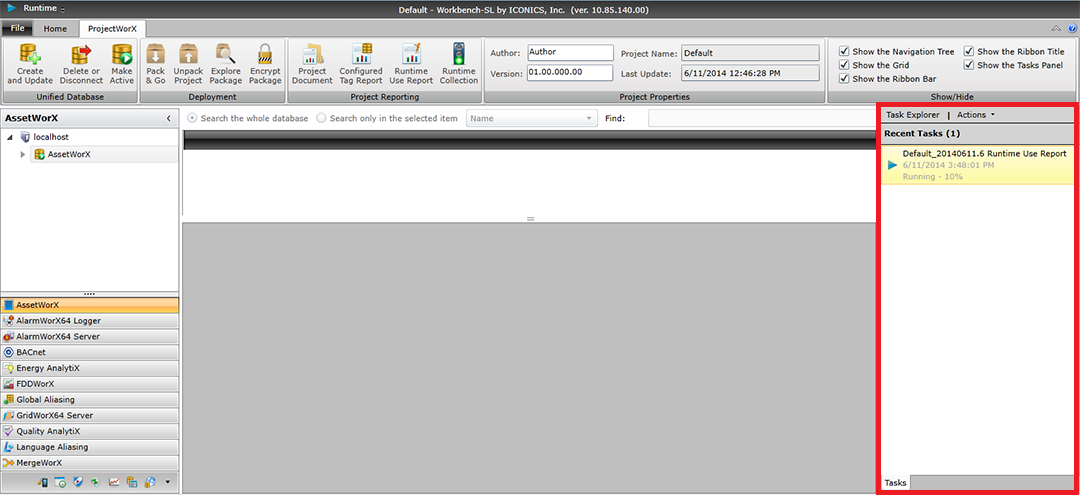
The Task Panel allows you to perform multiple actions related to the generated reports.
-
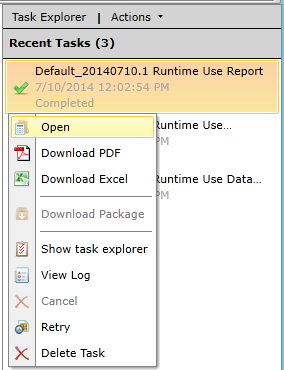
You can right-click on the completed Runtime Use Report task in the Tasks Panel for additional options, including Open, Download PDF, Download Excel, Show task explorer, View Log, Retry and Delete Task. [Note: The same right-click options are available when viewing the task within the Task Explorer.]
Right-Click Options for Runtime Use Report Task in Tasks Panel
-
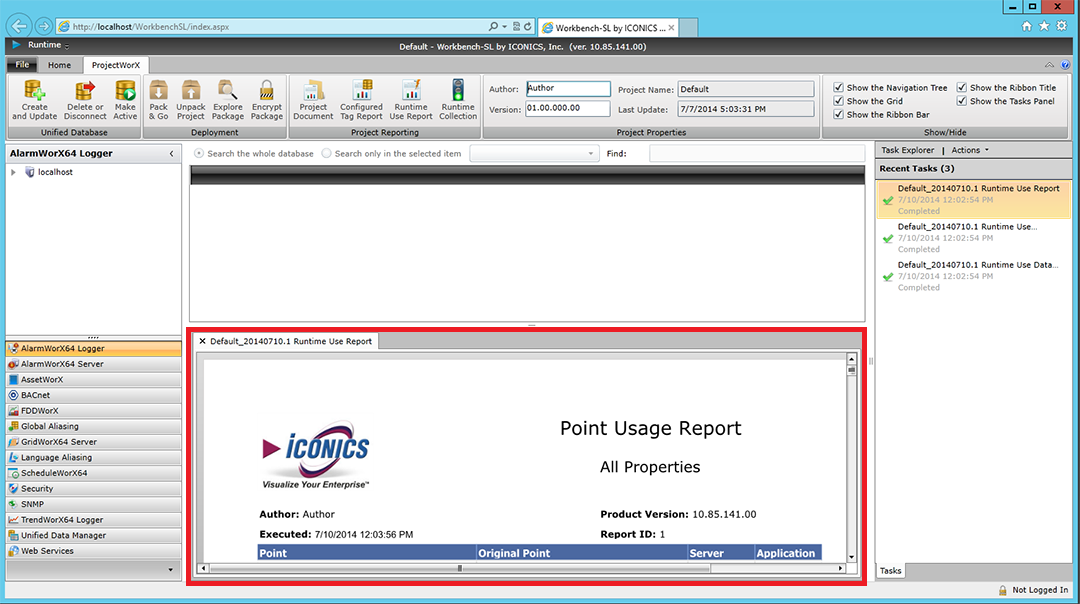
Click Open to open the created Runtime Use Report in a window directly within the Workbench, as shown below. Use the vertical and horizontal scrollbars to navigate through the document.
Runtime Use Report Opened Within the Workbench
-
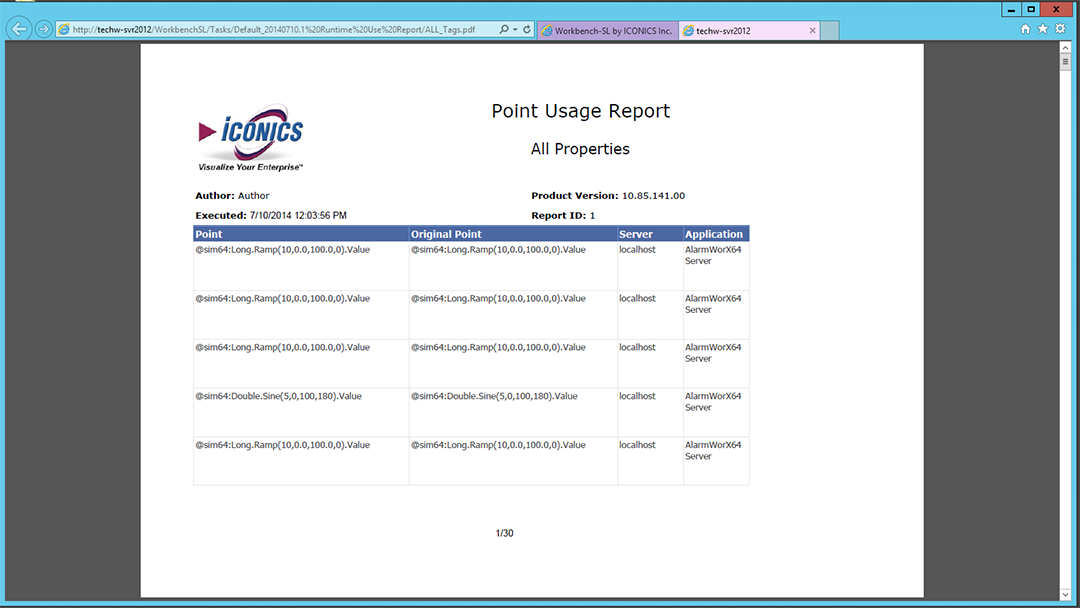
Click Download PDF to download a PDF version of the Runtime Use Report. The image below shows the PDF opened within Internet Explorer using Adobe Reader. Other PDF readers will allow for different/additional options.
Downloaded PDF Opened Within Internet Explorer Using Adobe Reader
-
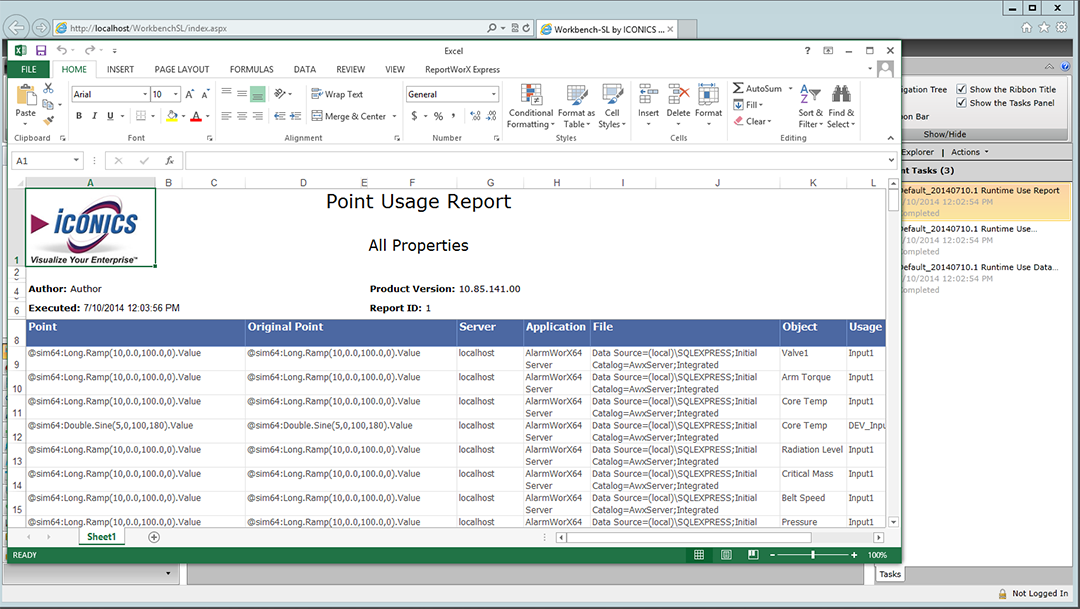
Click Download Excel to download an Excel version of the Runtime Use Report. Once selected, you'll have the option of opening the Excel file directly, saving it in the default location, or saving it with your desired file name in your desired location.
Runtime Use Report Opened in Excel
-
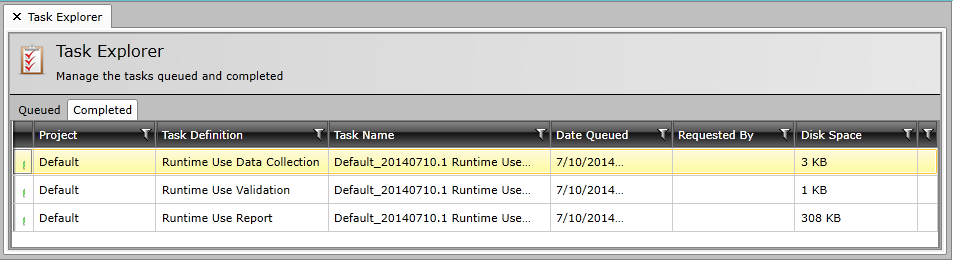
Click Task Explorer to see the status and additional information regarding the selected Runtime Use Report task, as shown below. Your task may be listed in either the Queued tab (if still running) or Completed tab.
Task Explorer Containing Completed Runtime Use Report Task
-
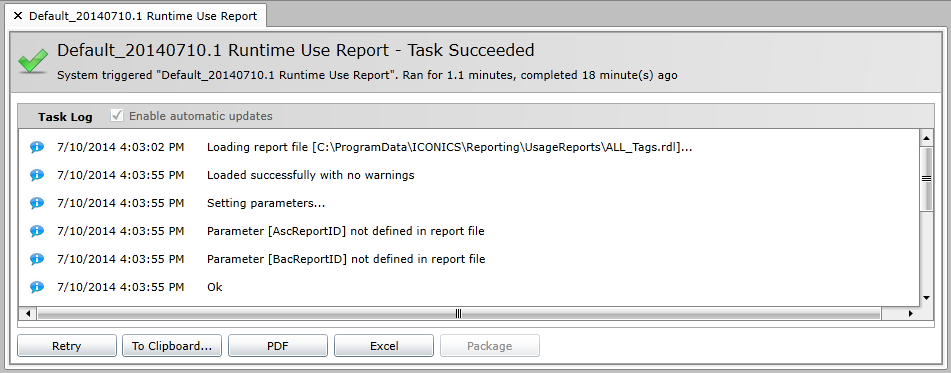
Click View Log to see the log for the Runtime Use Report task (whether running or completed), as shown below. You also have the option of saving the log to the clipboard or as a PDF document.
Log of the Runtime Use Report Task
Runtime Collection
Note that it is possible to pause the report generation by clicking on the Runtime Collection button, as shown below.
Runtime Collection Button in Stop and Start Modes


Generating a report may require additional time for larger configurations.
The task runs in the background so you can continue to work within the Workbench during report generation.
See Also: