Creating Custom Reports
To Create a Custom Report File:
-
Use Microsoft ReportBuilder 3.0 to create/edit the .rdl files.
-
Modify an existing rdl file is the easiest way to customize a report generated from the ProjectWorX tools. This is because the existing rdl file will contain predefined paramaters. It shows how to implement any required company/organization logo. It also shows how to create a data source.
-
Parameters involved include:
-
ProjectName
-
ProjectVersion
-
ProductVersion
-
Author
-
Validation – bool flag determines if validation columns should be shown
-
LogoFileName – Filename including extension of logo image
-
ImageServer – Server name where images are stored
-
SnapshotID – Snapshot ID of usage (runtime) data
-
AscReportID – ReportID of AssetWorX configuration data
-
BacReportID – ReportID of BACnet configuration data
-
EaReportID – ReportID of Energy AnalytiX configuration data
xxxID parameters are necessary to use in queries to filter data to only single snapshots.
Note: Some parameters have default values or allow null value.
-
Logos - Create an image select source as “External” and as value type:
="http://" & Parameters!ImageServer.Value & "/WorkbenchSL/Reporting/Logos/" & Parameters!LogoFileName.Value
-
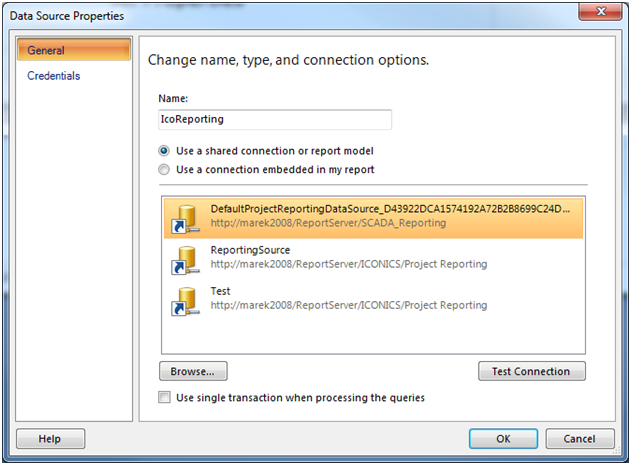
DataSources - Create a shared connection and browse for 'defaultProjectreportingDatasource' in the SCADA_Reporting folder:
Data Source Properties Window
-
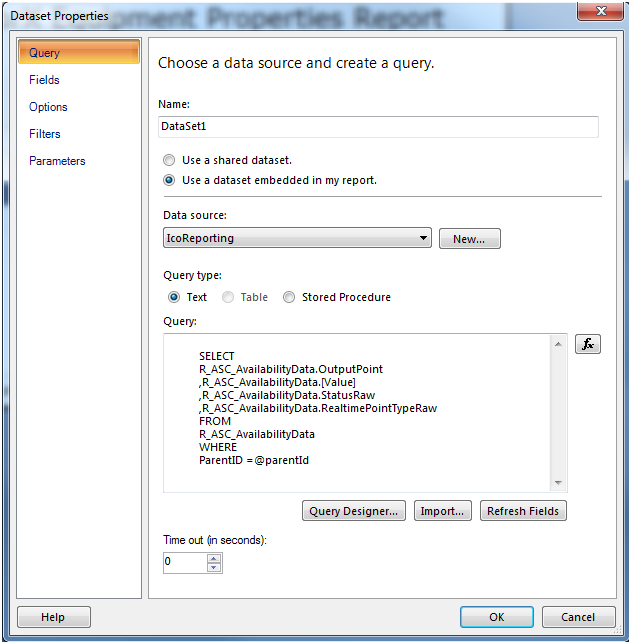
Create a dataset using IcoReportingSource, created in the previous step, to report from the IcoReporting database.
-
Do not forget to filter based on Snapshot/ReportID.
-
IcoReportingDatabase has views that help with certain fields. For example, it translates integer values to enum values where needed by using lookup tables. Feel free to use this as needed.
Dataset Properties Window
Choose Query Parameter Values

-
Create the report elements as needed.
-
The report must support paging. Otherwise, you will not be able to generate reports from large configurations. It might be a good idea to repeat the table header on every page.
Tablix Properties Window
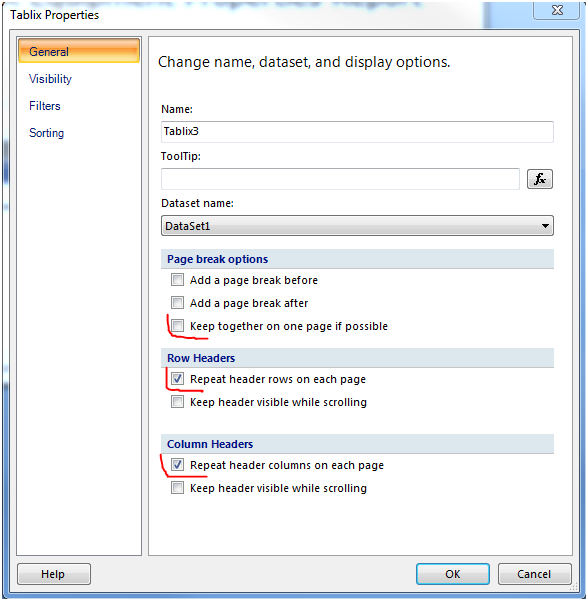
Note: Page brake options relate to groups, not to the control (tablix) itself.
Tips
-
Remember that reports can be generated to PDF for printing, including in A4 format. You should design reports so that they fit your intended output.
-
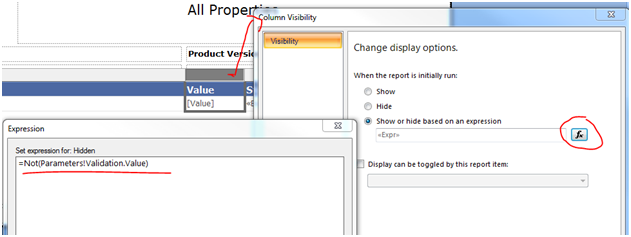
You can show/hide validation columns based on the Validation parameter.
Set Expression for Hidden
-
RDL files are located by default in C:\ProgramData\ICONICS\Reporting
-
You can create various elements:
Report Parts in 'Insert' Ribbon

There are wizards to help.
-
For data visualization, you will always need to create DataSources first. You can do so via wizard, as well (see step 6 above), that serves as a data feed for data visualization elements (like charts).
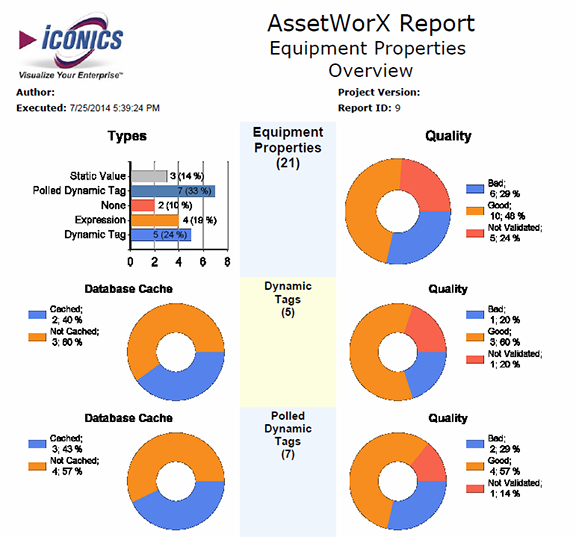
Sample Customized Report
See Also: