Degree Days Overview
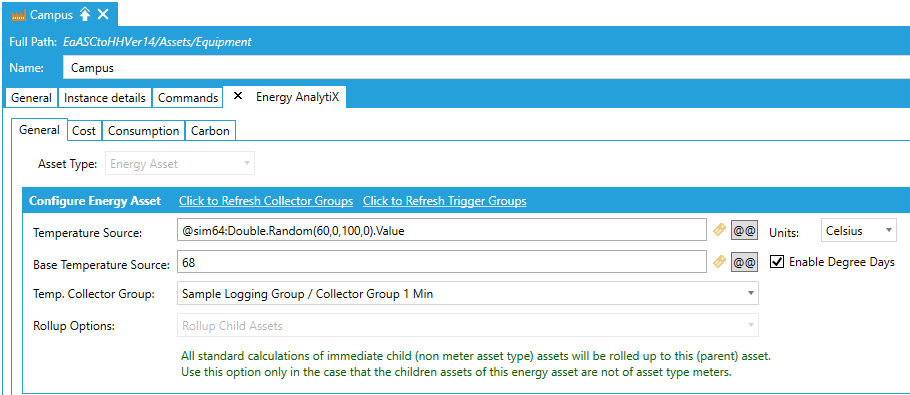
Degree Days analysis utilizes the heating and cooling degree days to estimate energy consumption. In Energy AnalytiX, when the user defines a temperature source for an energy asset and enables Degree Days several calculations will be added to facilitate degree days analysis. Both heating degree days as well as cooling degree days calculations will be added which will indicate how much a building or related energy asset required heating or cooling.
Enabling Degree Days Calculations in Energy Asset
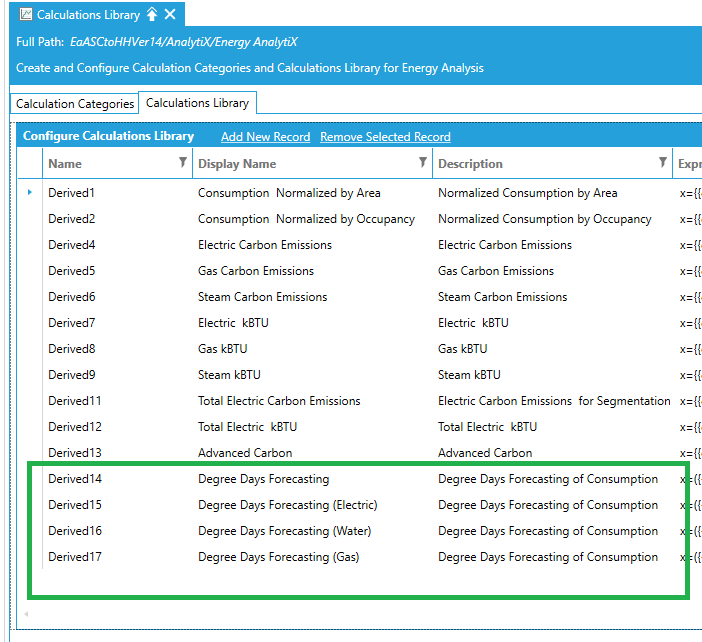
In addition, energy forecasting derived calculations based on degree days analysis can be added from the calculation library.
Degree Days Calculations in Calculations Library
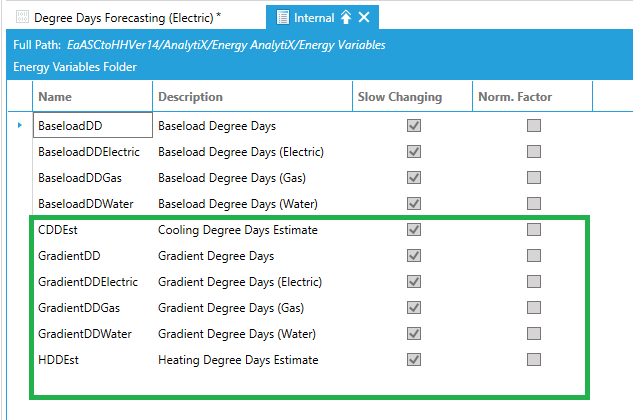
The degree days-based forecasting calculations utilize energy variables related to the:
-
Estimate of Heating Degree Days
-
Estimate of Cooling Degree Days
-
Baseload (from a Degree Days Analysis)
-
Gradient (from a Degree Days Analysis)
Degree Days Related Energy Variables
The degree days-based forecasting calculations utilize a daily trigger at 12:00 AM, to calculate energy consumption based on the forecasted degree days for the current day, which need to be available prior to midnight of the previous day.
The typical workflow for an end user is
-
Create a Degree Days Study
-
Evaluate the study using the CuSum tool in Workbench
Degree Days Study
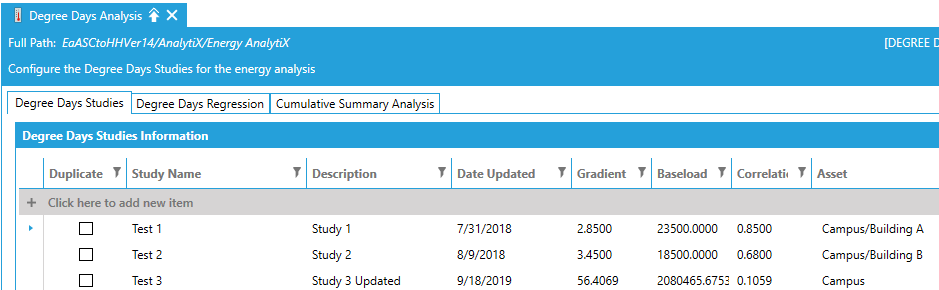
The user can define a Degree Days Study under the Degree Days Analysis node in Energy AnalytiX provider in Workbench. A degree days study represents a single variable regression of energy consumption based on degree days. The user can import data for an existing degree days study or create a new one inside Energy AnalytiX in the Workbench, where the following important variables are required:
Degree Days Studies in Workbench
-
Baseload
-
Energy consumed with no heating or cooling required
-
Gradient
-
Relation of degree days to energy consumption
-
Correlation
-
A measure of how well the degree days regression will perform. The closer to 1, the better
Creating a Degree Days Study
The user can create a degree days study using built-in tools in Workbench, under the Degree Days Analysis node. In the related form the user can pick a desired asset, time interval, meter type to create an initial degree days study and then he can customize it by excluding certain energy data which are mostly outlier energy data values.
Degree Days Regression in Workbench
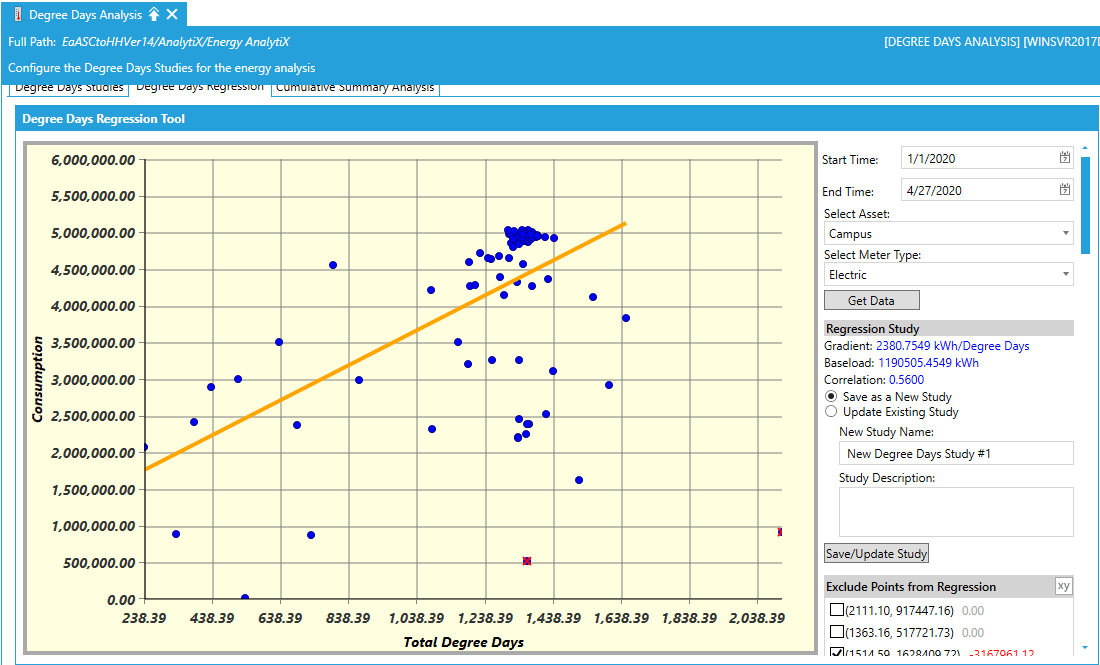
Important note: Currently our meter data spikes repair support does not take into consideration the timezone of the energy meter. We will add this support in a future release.
The Degree Days Regression tab accomplishes this task. The user can select a time range, an energy asset, a desired meter type (energy source) as inputs to the degree days regression study. Then by clicking on the Get Data button, the daily data for the related consumption and degree days will be retrieved and an initial regression on the available data will be performed.
The user can then visually exclude data points which are mostly outliers or improper data which will automatically trigger regression re-calculation.
The gradient, baseload and correlation coefficient will be displayed and adjusted accordingly based on data point inclusion or exclusion. The closer to the value of 1.0 the correlation coefficient is, the better the regression. Finally, the user can save the degree days study by providing a name and clicking the Save/Update button.
Evaluating a Degree Days Study
Once a degree days study is saved to the database, the end user can evaluate the degree days study using the Cumulative Summary Analysis tab under the Degree Days Analysis node in Workbench.
Cumulative Summary Analysis in Workbench
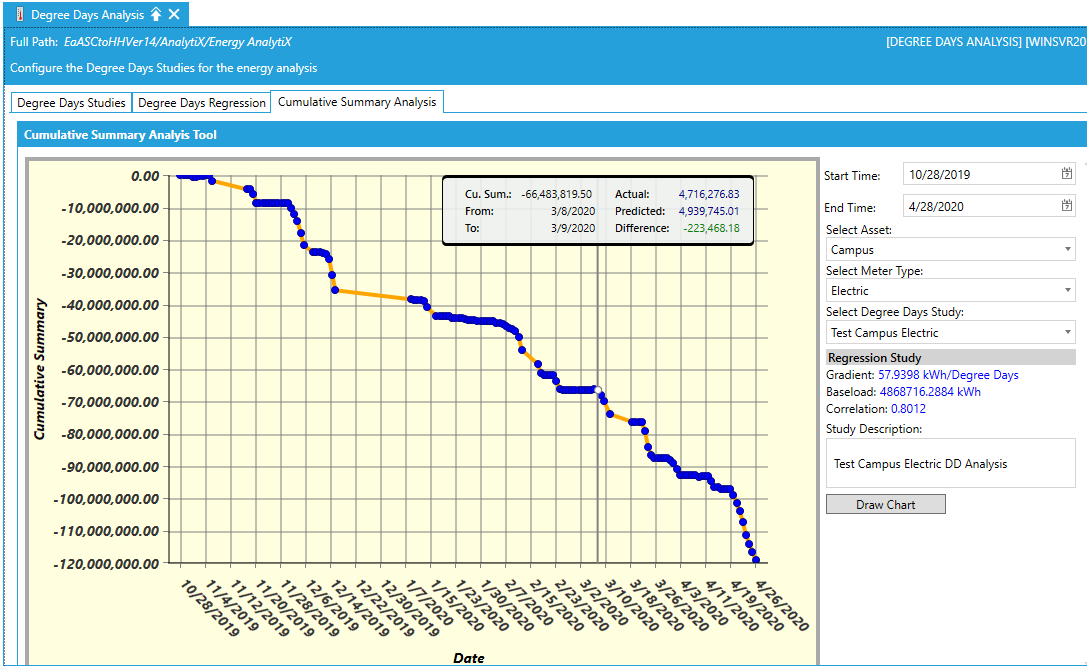
The user can select a current time range to compare energy data against the degree days study, an energy asset and a meter type. Then, the user can select a dedicated saved degree days study and by clicking on the Draw Chart button the cumulative sum chart will be drawn, which will clearly display if the current energy data adhere to the degree days regression model or are much different. The chart tooltip will display both the estimated consumption value based on the degree days study as well as the actual consumption value. In this way, we can evaluate if energy reducing initiatives applied in the current time interval are producing the desired result. We can also evaluate if our energy consumption is becoming much larger compared to historical periods which may indicate opportunities for improvements.
See Also: