Degree Days Analysis Node
The Degree Days Analysis node in Workbench has three tabs
To Configure Degree Days Studies:
Degree days studies can be entered manually or by using the Degree Days Regression tab and creating a new degree days study.
-
Open your project in the Workbench, then expand your project in the Project Explorer, then expand the AnalytiX node and then the Energy AnalytiX node.
-
Double-click on the Degree Days Analysis node (or right-click and select Edit from the pulldown menu or select the node then click on the Edit button in the Edit section of the Home ribbon).
-
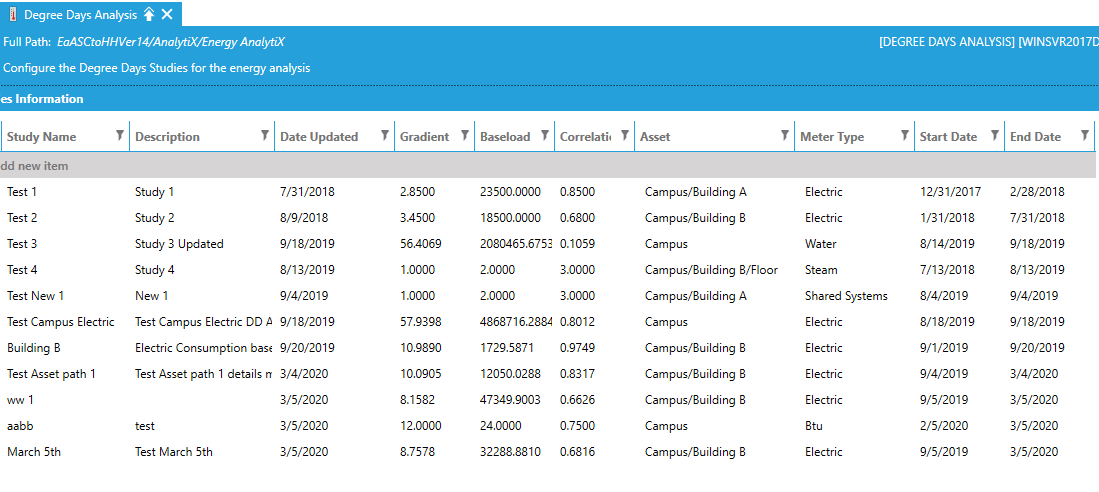
This opens the Degree Days Analysis properties, shown below.
Degree Days Analysis Properties

Degree Days Studies Tab
-
Study Name -The name of the degree days study. It will have to be a unique name.
-
Description -A description for the degree days study
-
Date Updated -The date the study was inserted or updated.
-
Gradient – The gradient coefficient of the study.
-
Baseload -The baseload value of the study.
-
Correlation – The correlation coefficient of the study.
-
Asset - Use the pulldown menu to select the corresponding energy asset.
-
Meter Type - Use the pulldown menu to select a Meter Type from Btu, Electric, Gas, Lights and Fan, Receptacles, Shared Systems, Steam, Total Electric, or Water.
-
Start Date -The start date of the study.
-
End Date -The end date of the study.
Degree Days Regression Tab
Degree Days Analysis – Degree Days Regression Tab

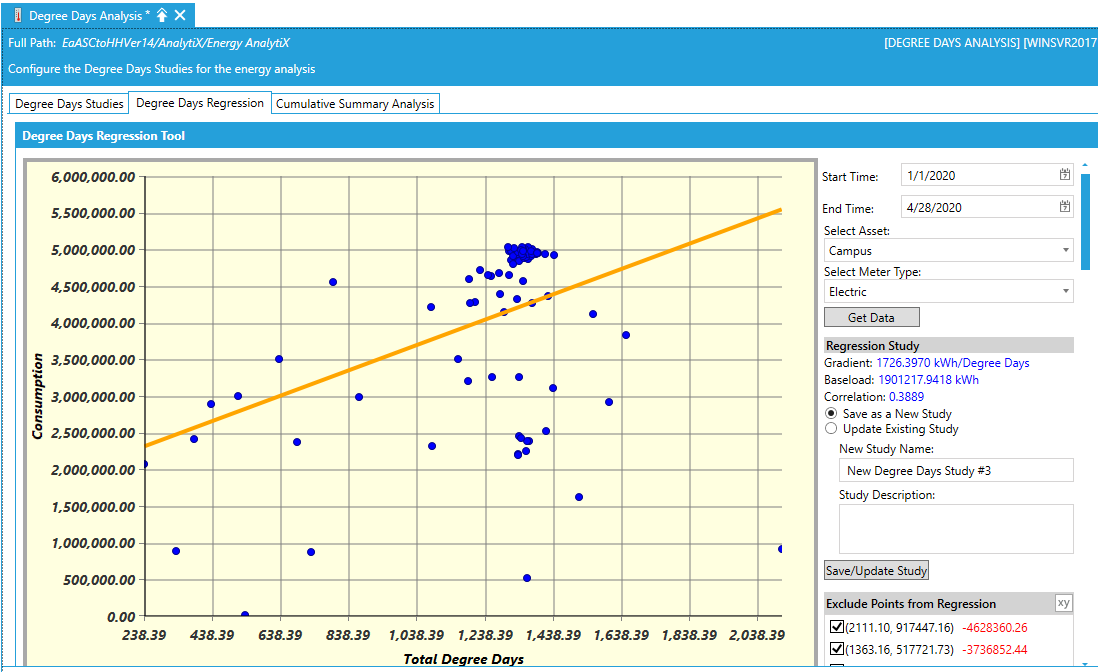
Get Data ....
-
Start Time -Enter a start time in the text entry field or click on the
 button
to open the Date and Time picker window to select your start time.
 -
End Time -Enter an end time in the text entry field or click on the
 button
to open the Date and Time picker window to select your end time.
 -
Select Asset -Select the desired energy asset from the pulldown menu.
-
Select Meter Type -Select the related meter type from the pulldown
Save/Update Study ….
-
Gradient – Gradient coefficient of the degree days regression automatically calculated based on data points included.
-
Baseload -Baseload value for the study automatically calculated. It is related to the energy consumption if weather conditions were to be ignored.
-
Correlation – Correlation coefficient of the study indicating the goodness of fit measure automatically calculated. The closer to 1.0 the better.
-
Save a New Study – Saves a new degree days study.
-
Update Existing Study – Updates an existing degree days study.
-
Study Name - Displays study name.
-
Description – Displays the study description.
-
Exclude Points from regression – allows the user to visually exclude regression points from a given study.
-
xy – Allows the user to sort degree days study data points by (x,y) distance or by deviation.
The Get Data button will display the related energy consumption data and it will perform a regression of energy consumption based on degree days totals. This will create a simple data model using historical (reference) data on how the weather temperature and target heating or cooling goals influence energy consumption.
Cumulative Summary Analysis Tab
Degree Days Analysis – Cumulative Summary Analysis Tab

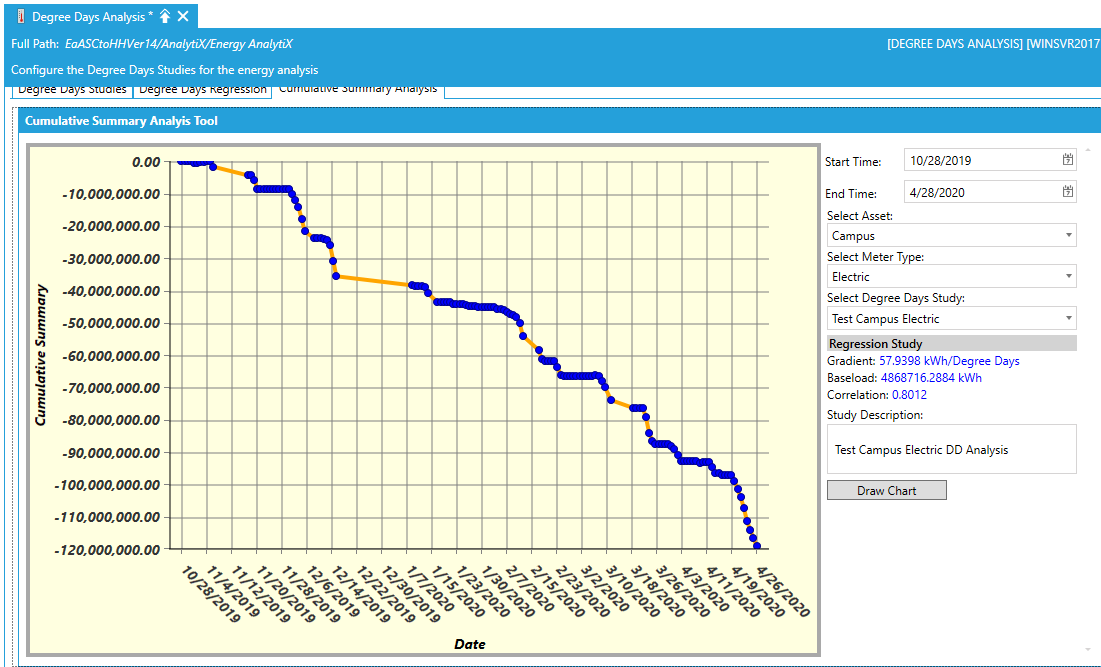
Draw Chart ....
-
Start Time -Enter a start time in the text entry field or click on the
 button
to open the Date and Time picker window to select your start time.
 -
End Time -Enter an end time in the text entry field or click on the
 button
to open the Date and Time picker window to select your end time.
 -
Select Asset -Select the desired energy asset from the pulldown menu.
-
Select Meter Type -Select the related meter type from the pulldown
-
Select Degree Days Study -Select the related degree days study from the pulldown
The Draw Chart button will display the comparison of current energy consumption to the degree days study historical data-based regression model. The tooltip will display analytical information on how the current consumption data compare to the predicted ones using the degree days analysis study.
See Also: