Axes Properties in Charts in AlarmWorX64
Axes Properties in Charts in AlarmWorX64
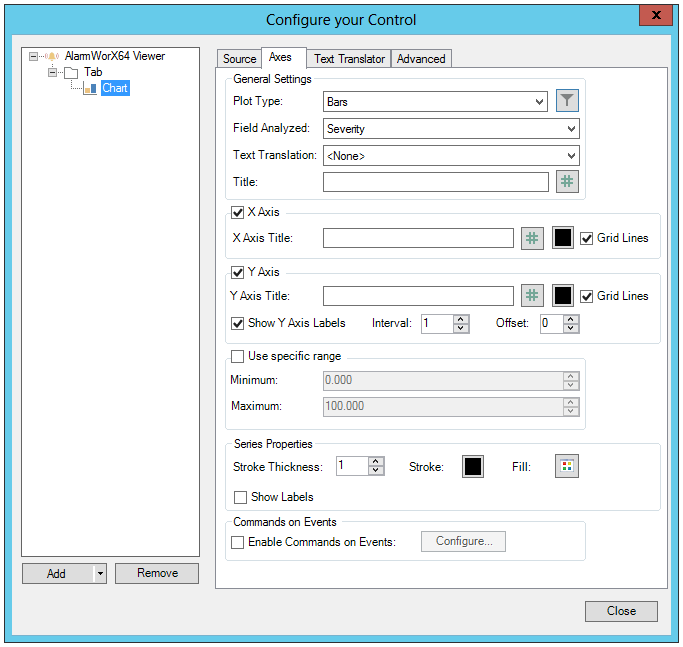
General Settings
-
Plot Type - Use the pulldown menu to select from Bars, Pie, or Donut. The remaining properties in the Configure your Control window may change or become inactive based on your selection. You can also opt to click on the
 button, which will
allow you to configure default client side filters.
button, which will
allow you to configure default client side filters. -
Field Analyzed - Use the pulldown menu to select from <None>, AckRequired, ActiveTime, ConditionName, NewState, OriginalSource, StatusCode, SubConditionName, EventClass, EventId, EventType, Message, Severity, SourceName, Category, or AREA.
-
Text Translation - Use the pulldown menu to select from New State Translation, Event Type Translation, or Category Translation. See Text Translator Tab Options in AlarmWorX.
-
Title - Enter a title in the text entry field or click on the
 to
open the Data Browser and navigate to your selected data source/title.
to
open the Data Browser and navigate to your selected data source/title.
X Axis
-
X Axis - This section is activated for the Bars Plot Type. Click the checkbox if you wish to include the X Axis.
-
X Axis Title - Enter a title for the X Axis in the text entry field or or click on the
to
open the Data Browser and navigate to your selected data source/X
Axis Title. You can also click on the  button to open the Color properties
that you can change for the X Axis Title.
button to open the Color properties
that you can change for the X Axis Title. -
Grid Lines - Click this checkbox in order to include grid lines in the X Axis of your chart.
Y Axis
-
Y Axis - This section is activated for the Bars Plot Type. Click the checkbox if you wish to include the Y Axis.
-
Y Axis Title - Enter a title for the Y Axis in the text entry field or or click on the
to open the Data Browser and navigate to your selected data source/Y
Axis Title. You can also click on the button to
open the Color properties that you can change for the Y Axis Title.
-
Grid Lines -Click this checkbox in order to include grid lines in the Y Axis of your chart.
-
Show Y Axis Labels - Click this checkbox in order to include labels for the Y Axis of your chart.
-
Interval - Enter an interval, in the text entry field (or use the up/down arrow buttons) of the Y Axis labels in your chart.
-
Offset - Enter an offset, in the text entry field (or use the up/down arrow buttons) of the Y Axis labels in your chart.
Use specific range
-
Use specific range - Click this checkbox in order to set a specific range using your configured axes in your chart.
-
Minimum - Once this section is activated, you can enter a minimum number in the text entry field, or use the up/down arrow buttons
-
Maximum Once this section is activated, you can enter a maximum number in the text entry field, or use the up/down arrow buttons
Series Properties
-
Stroke Thickness - Enter a number, in the text entry field, or using the up/down buttons, for the stroke in the Axes within the chart.
-
Stroke - Click on the
button
to open the Color properties that you can change for the Y Axis Title.
-
Fill - Click on the
 button
to open the "Selet a palette for your chart" window, where
you can opt to use a predefined set of colors or use one color.
button
to open the "Selet a palette for your chart" window, where
you can opt to use a predefined set of colors or use one color. -
Show Labels - Click this checkbox to show labels for the series properties.
Commands on Events
-
Enable Commands on Events - Click this checkbox to enable commands for events using the Axes on your chart. Clicking the Configure button will open the Control Events Configuration window.
Note: The AlarmWorX64 Viewer is one of many controls that now supports executing commands on events. These events vary per control, but for the AlarmWorX64 Viewer they include:
-
Middle Click
-
Right Click
-
Sample Click
-
Sample Double Click
Event - Select a control event and configure actions to fire when the event occurs. Use the pulldown menu to select from Busy, Ready, Row Selected, or Started.
Commands - List of commands to perform when selected control event occurs. Click on the plus sign [+] to add an item to the list. Click on the minus sign [-] to remove a listed item. Click on the up arrow to move a selected item higher in the list. Click on the down arrow to move a selected item lower in the list. Click on the button to duplicate a selected entry in the list. For any Custom Command selected in the list, you can then select a specific Command and then complete the associated properties for that command. Click HERE for more info on Commands in GraphWorX64.
See Also: