Schedules Runtime Visualization Overview
Schedules can be visualized in runtime as a part of a GraphWorX display, either by assigning process points to a specific schedule or by embedding Schedule Control in the display.
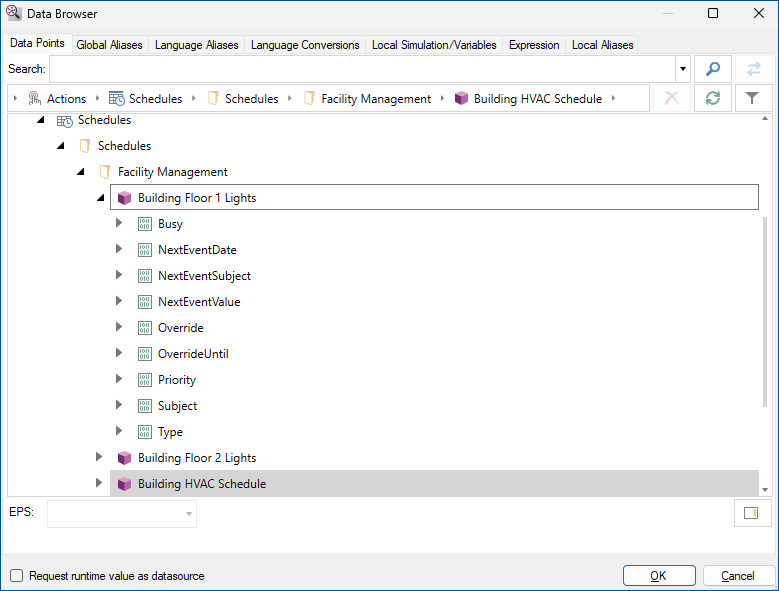
To visualize schedule fields as process points, use Data Browser to navigate to the desired schedule and expand the schedule node to see all available fields to which you can connect.
After connecting the selected data tags to the process points, you can switch GraphWorX to runtime and view the result as shown below.
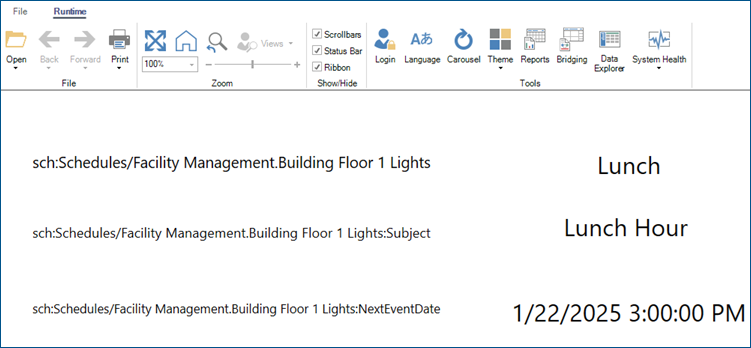
When there is no upcoming schedule event, the NextEventDate runtime field is set to the maximum supported invariant-culture date. If a later holiday event exists, NextEventDate is the start of that holiday event.
You can also use Schedule Control to graphically visualize a specific schedule. Learn more