Chart Pen Settings in Trend Viewer
The Pens tab of the Chart object in the Trend Viewer configuration holds the settings that apply to every pen in the chart: how the chart plots samples of bad or uncertain quality, how many samples a pen keeps, how wide the bars in the bar plots are, and the defaults for pens that are added in runtime. Settings that belong to a single pen, such as its data source, are on the Pen object instead. Learn more
To open these settings, double-click anywhere in the Trend Viewer control to open the configuration dialog, in the left panel select Chart, and then in the right panel select the Pens tab. The same settings are also available on the Advanced tab, in the Pens section of the property grid. The settings apply in the desktop application and in the web browser client alike.
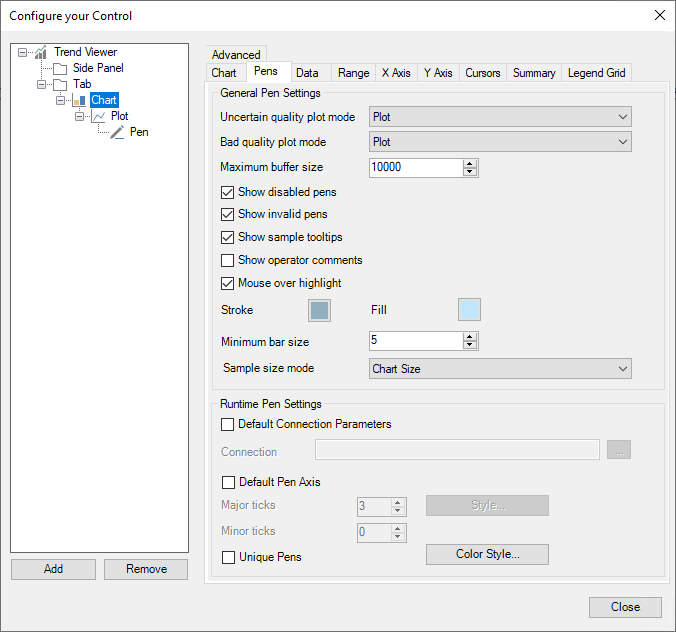
General Pen Settings
|
Setting |
Default |
Description |
|---|---|---|
|
Uncertain quality plot mode |
Leave gap |
How the chart plots samples with uncertain quality. The options are the same as for Bad quality plot mode. |
|
Bad quality plot mode |
Leave gap |
How the chart plots samples with bad quality. Leave gap leaves a gap in place of the sample, Plot draws the sample as if its quality were good, and Span Over stretches the plot over the sample. |
|
Maximum buffer size |
10000 |
The upper limit for the number of samples a pen keeps when the chart calculates the pen buffer size automatically from the trend period and the sampling interval. |
|
Show disabled pens |
Selected |
Shows disabled pens in areas of the control such as the legend. |
|
Show invalid pens |
Selected |
Shows pens whose data source is invalid or cannot be resolved in the chart and in the legend. |
|
Show sample tooltips |
Selected |
Shows a tooltip with the sample description when you hover over a sample. |
|
Show operator comments |
Cleared |
Shows operator comments for the pens whose data source supports them. |
|
Mouse over highlight |
Selected |
Highlights the bar or pie slice under the mouse pointer with the Stroke and Fill brushes. The default for both brushes is light blue. |
|
Minimum bar size |
5 |
The narrowest bar the chart draws in the bar plots, in pixels. The smallest value is 1. See Bar Width in Bars Plots. |
|
Sample size mode |
Chart Size |
How the chart calculates the width of the bars in the bar plots: Chart Size or Sampling Interval. See Bar Width in Bars Plots. |
Runtime Pen Settings
These settings apply to pens that are added while the display runs, not to the pens you configure in the dialog.
|
Setting |
Default |
Description |
|---|---|---|
|
Default Connection Parameters |
Cleared |
Fills in the Connection parameters for pens added in runtime. A pen that declares its own connection parameters keeps them. Use the button next to the field to configure the parameters or to browse for them. |
|
Default Pen Axis |
Cleared |
Applies a default axis configuration to pens added in runtime. Major ticks and Minor ticks set the number of tick marks on that axis, and Style opens the full axis configuration. |
|
Unique Pens |
Cleared |
Rejects a pen added in runtime when a pen with the same data source is already in the chart. |
|
Color Style |
Twelve preset colors |
Opens the palette of colors that the chart assigns to new pens. The colors are assigned in order, and the palette starts over when all of the colors have been used. |
Bar Width in Bars Plots
In the Bars, Stacked Bars, and 100 % Stacked Bars plot types, the chart calculates the width of each bar from the width of the chart area and a count of samples, and it never draws a bar narrower than Minimum bar size. When more samples fall in the chart period than fit at that width, the chart leaves out the bars that would overlap the bar before them. The samples are still there: when you move the cursor over the gap, the cursor tooltip shows their values.
Sample size mode selects which count of samples the chart divides the width by:
-
Chart Size—The number of samples currently displayed in the chart. As samples arrive, the count grows and the bars get narrower, until they reach the minimum bar size and the chart starts to leave bars out. This is the default.
-
Sampling Interval—The trend period divided by the sampling interval, that is, the number of samples the chart expects in the period. The bar width stays constant, and every expected sample has room for a bar as long as that width is not below the minimum bar size.
If a Bars plot does not show all of its bars, set Sample size mode to Sampling Interval. If bars are still missing, lower Minimum bar size.