Adding Process Points
In this section, you will add process points and examine each point's changing values. Process points represent variable data that is coming from a data source. The liquid tank's density, depth, inner pressure, and temperature are examples of process points. You can monitor these process points, collect them as historical data, or trigger alarms. We will create temperature and depth process points as an example.
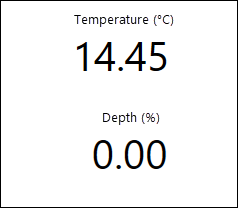
Adding a Temperature process point allows you to immediately see minor changes originating from the Tank 01 data source. Other related tank process point values will not change since the liquid isn't entering or exiting the tanks. Learn more
By adding a Depth process point, you can view the percentage of liquid filling Tank 01. After creating the Depth process point and viewing it in runtime, you may notice that the value does not change. This is expected, since the Pump 01 - Input is off and the Valve 01 - Input is closed. In the next topic, you will create control buttons that turn the pumps on and off and open and close the valves. Learn more
To add a Temperature process point to a display:
- Open GraphWorX. Learn how
- In the lower right corner of the GraphWorX display, click the Mode drop-down list and select Desktop App.
- On the Dynamics ribbon tab, click Process Point
 .
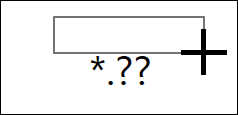
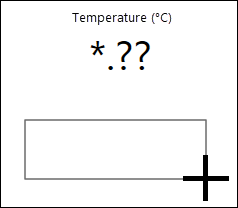
. - On the canvas (the main pane), click and drag your mouse diagonally to place and size the process point.
- In the Dynamics panel on the right in the Data section, click
 next to DataSource to open the Data Browser, and then do the following:
- On the Data Points tab, expand Assets > Tank Farm Management System > Tanks > Tank 01.
- Select Temperature (°C) and click OK to close the Data Browser.
- Select the Home ribbon tab and in the Shapes section, click
 to draw a label on the canvas.
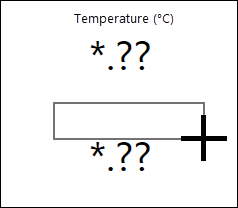
- On the canvas, click and drag to size and place the label above the Temperature process point.
- Double-click the new label and type Temperature (°C).
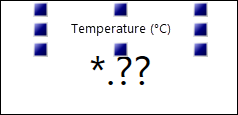
- On the canvas, click and drag to size and place the label above the Temperature process point.
-
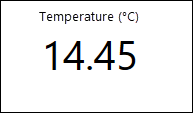
In the upper right corner, click Runtime to view the process point values. GraphWorX switches to the runtime mode and the toggle changes to Configure.
- When finished, click Configure in the upper right corner to return to the configuration mode.
To add a Depth process point to a display:
- On the Dynamics ribbon tab, click Process Point.
-
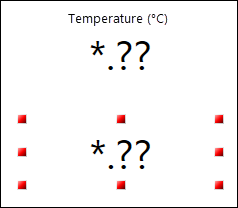
On the canvas, click and drag to size and place the process point below the Temperature process point.
-
In the Dynamics panel on the right in the Data section, click
next to DataSource to open the Data Browser, and then do the following:- On the Data Points tab, expand Assets > Tank Farm Management System > Tanks > Tank 01.
- Select Depth and click OK to close the Data Browser.
-
Select the Home ribbon tab and in the Shapes section, click
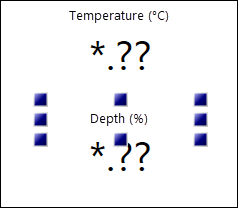
to draw a label on the canvas.- On the canvas, click and drag to size and place the label above the Depth process point.
- Double-click the new label and enter Depth (%).
-
In the upper right corner, click Runtime to view the process point values.
- When finished, click Configure in the upper right corner to return to the configuration mode.