Monitoring Bridging Activities as a Client
You do not need Workbench to see what Bridging is doing. A GraphWorX display can present transaction activity in runtime in two ways:
-
With the Bridging controls—The Bridging Navigator browses the configured transactions, and the Bridging Viewer lists the executions of whatever the navigator selects. A Table control bound to the Bridging .Query point adds the activity-by-activity log of a selected execution. Learn more
-
With Bridging data points—Every transaction publishes its status as ordinary data points, so you can use a label or a tile to show it without any Bridging-specific control.
GraphWorX also includes a ready-made Transaction Manager page in runtime under Tools. Review it to consider using it directly before you build a display of your own.
 To build a transaction monitoring display with controls:
-
Open GraphWorX in the configuration mode (default).
-
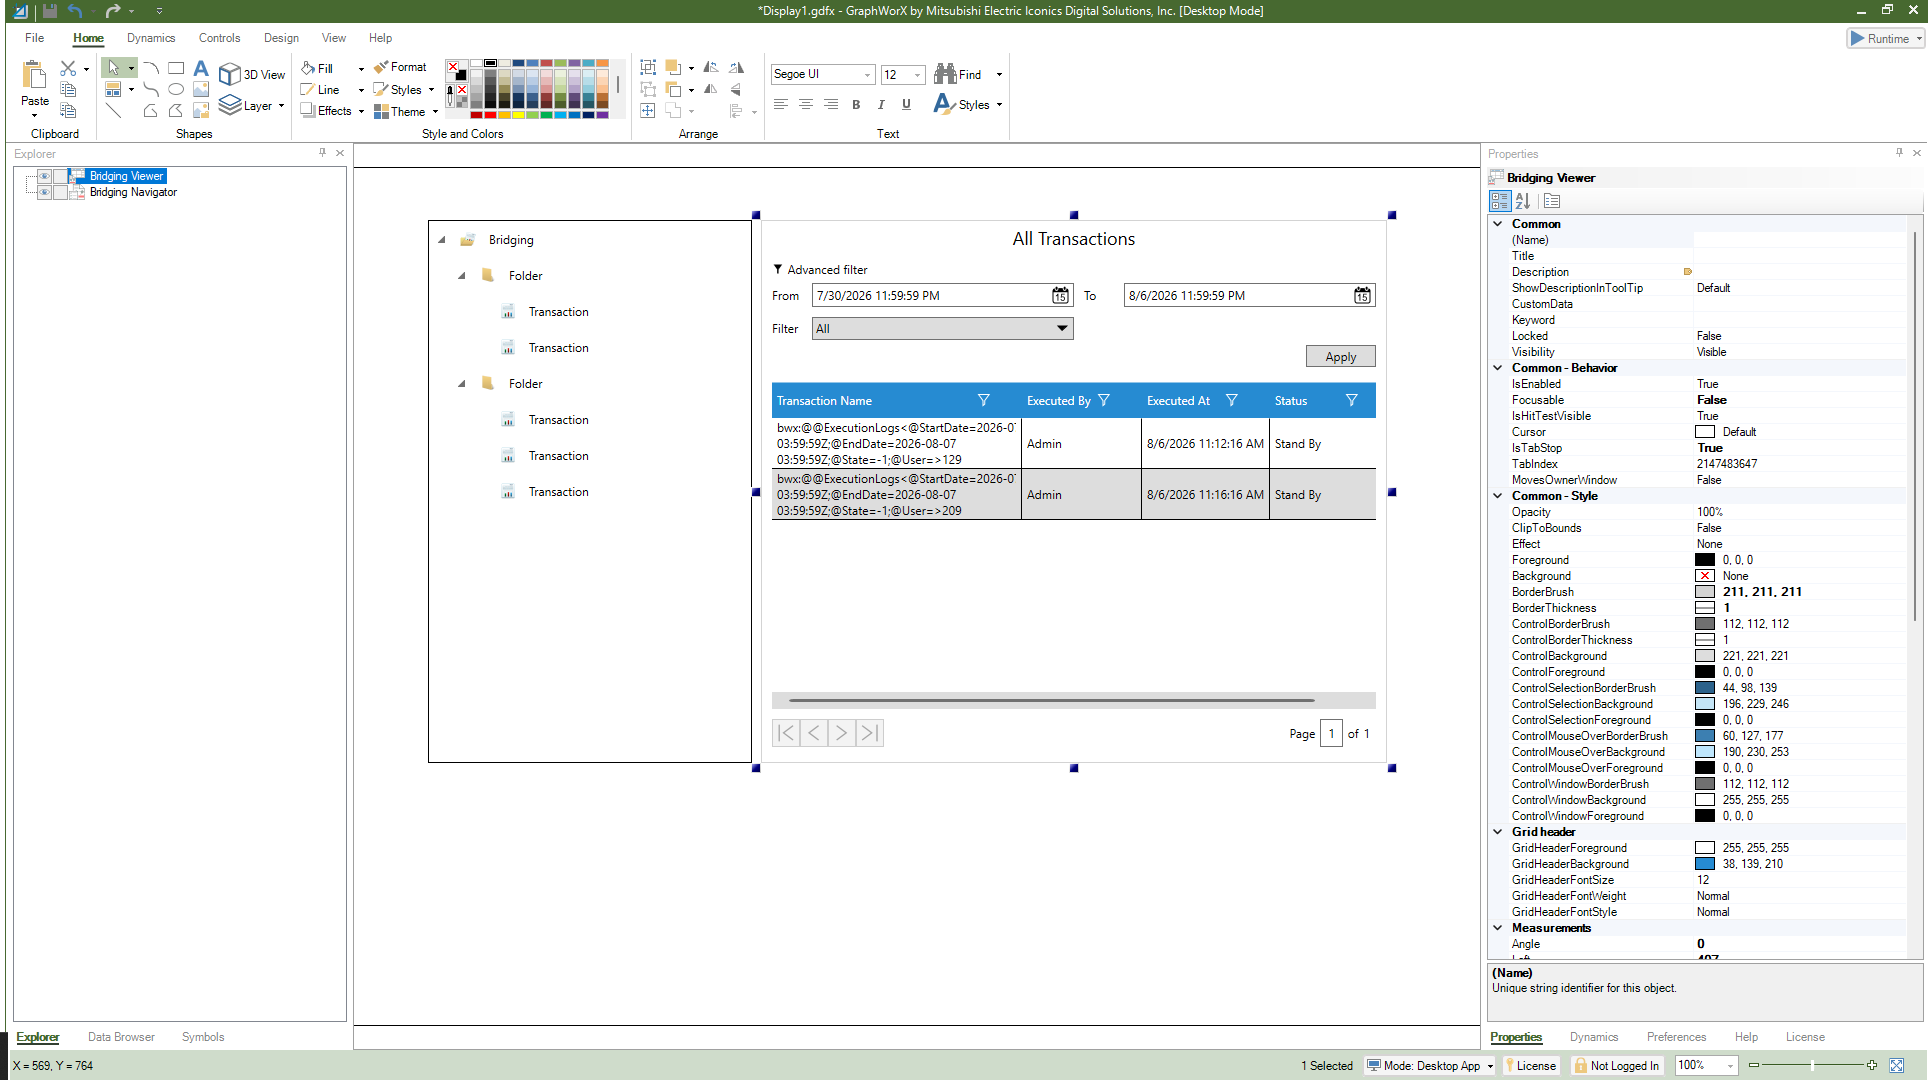
On the Controls ribbon, select Bridging Navigator, and then drag the mouse diagonally across the canvas to place the control. It fills with a tree of the configured transactions.
-
On the Controls ribbon, select Bridging Viewer and place it beside the navigator.
-
Select the viewer. On the Properties tab in the right panel, navigate to the Misc - Commanding section and set CommandingName to Viewer. This registers the control so that the navigator can send commands to it.
-
Double-click the navigator to open the configuration. Then complete the following settings so that a selection in the tree loads into the viewer, and then click OK.
-
In the Navigator section in Root Node Path, enter bwx:.
-
In the Load Command Targets section, enter Viewer in both Transaction and Executed Transactions.
-
-
Add a Table control below the viewer to show the log of the selected execution, and configure its query.
-
In Data Source, browse to Bridging and select the .Query data point.
-
In Table, select ActivityTraces.
-
On the FIELDS tab, select
 to refresh the list of fields to bring in the new bridging datasource fields.
 -
On the COLUMNS tab, repeat the same to update the list of columns.
-
On the FILTERS tab, add a filter on the WorkflowInstanceID field with the value
<#TransactionInstanceID#>, so the table shows only the selected execution.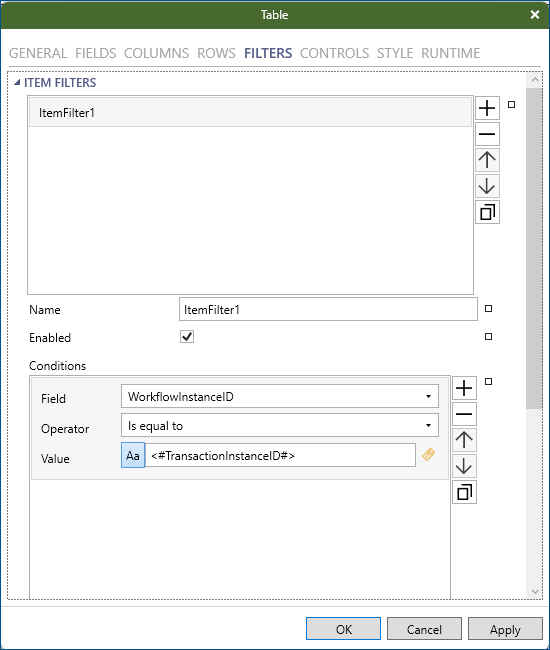
-
-
Double-click the Bridging Viewer and in the configuration dialog, do the following:
-
On the RUNTIME tab, select the checkbox next to Commands on Events to enable the command settings.
-
In Event, select Row Selected.
-
Add a command that sets the global aliases used by the table. Use the following expression, which publishes the instance of the row that the operator selects:
x="#TransactionInstanceID=" + {{@@control.transactioninstanceid}} + ";"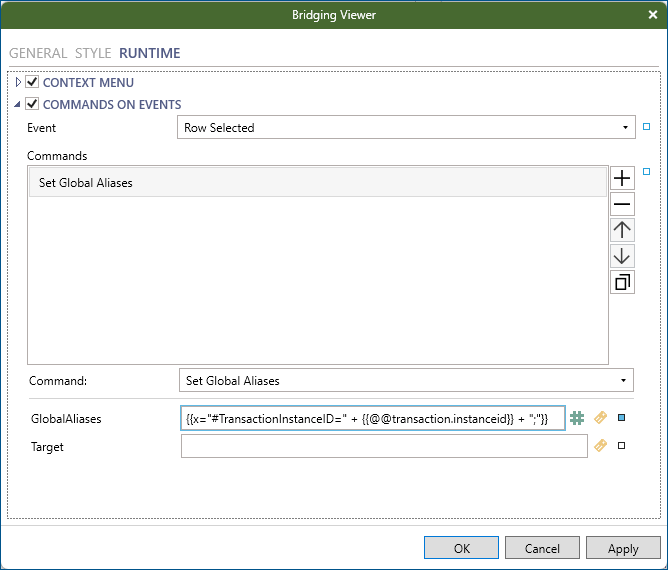
-
-
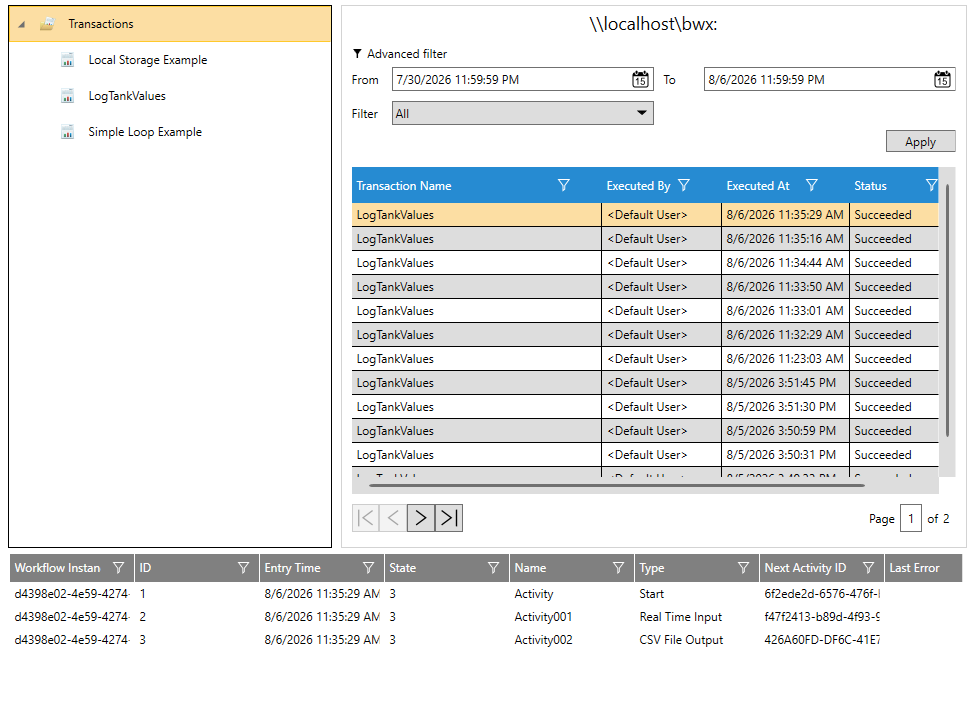
Save the display and switch to runtime. Select a transaction in the navigator; the viewer lists its executions, and the tables fill in when you select one.
Since these are ordinary GENESIS data points, any dynamic you can apply to a device tag works the same way on a transaction. The following procedure drives the fill color of a shape from the result of a transaction's most recent execution, so that an operator sees green when it last succeeded and red when it last failed.
To monitor a bridging transaction using data points:
-
Open GraphWorX in the configuration mode (default).
-
Draw the shape you want to use as the indicator on the canvas—an ellipse, for example—and keep it selected.
-
On the Dynamics tab in the right panel, select
 to add a Color dynamic.
 -
In the Data section, select DataSource and click
 to open Data Browser.
 -
Browse to Bridging, expand the folder that holds your transaction, select the transaction's @@LastExecutedStatus point, and then click OK.
-
In Dynamic Behavior in TargetPropertyName, select Fill so that the dynamic drives the interior of the shape.
-
Set the color for when the value is 3 to green.
The full list of result status code meanings can be found here.
-
On the Dynamics tab, click
 to create a copy of the Color dynamic. Set the LowLimit to 4 and the EndColor to red.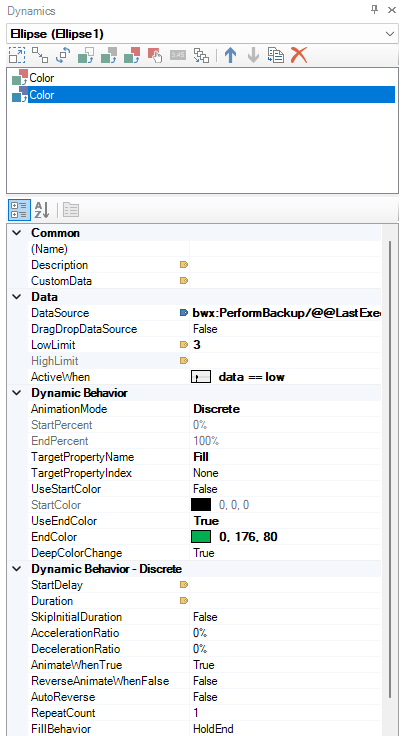
-
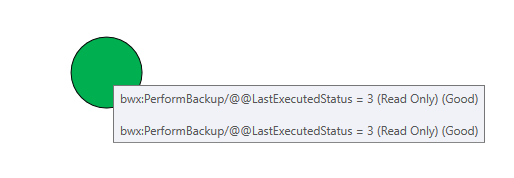
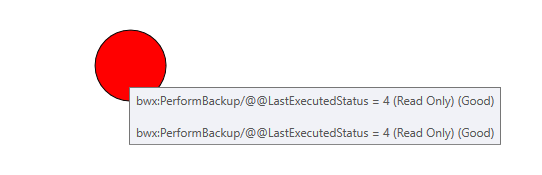
Save the display and switch to runtime to verify the results. If the most recent execution of the transaction resulted in a success, it should appear green. If it failed, it will be red.
Result after successful execution:
Result after failed execution:
For the full list of points, the .Query dataset point, and performance counters, see Bridging Data Points.