Adding a Table Control
The GraphWorX Table control visualizes a data set or a query in a customizable table.
To use a query as the data source, the data must come from a component that supports query interface. Learn more
To add a Table control to a GraphWorX display:
-
Open GraphWorX and on the Controls ribbon, select Table, and then click in the canvas and drag the mouse diagonally to make a rectangle for inserting the table.
-
Double-click the control to open the configuration dialog.
-
On the GENERAL tab in the Data Source section, do the following:
-
In Type, select the desired data source type (Query or Dataset).
-
In Data Source, click
 to open Data Browser. Then expand the desired component, select the desired data source, and click OK. The selected data point is added to the Data Source text box, and the Table drop-down list is populated with available tables for the selected source.
 -
In Table, select the desired option.
-
-
On the FIELDS tab, click
 next to the field list to load the fields available for the selected table. Optionally, customize the settings for each field as desired. Use the button menu to add, remove, or copy fields and change the order in which they appear in the table.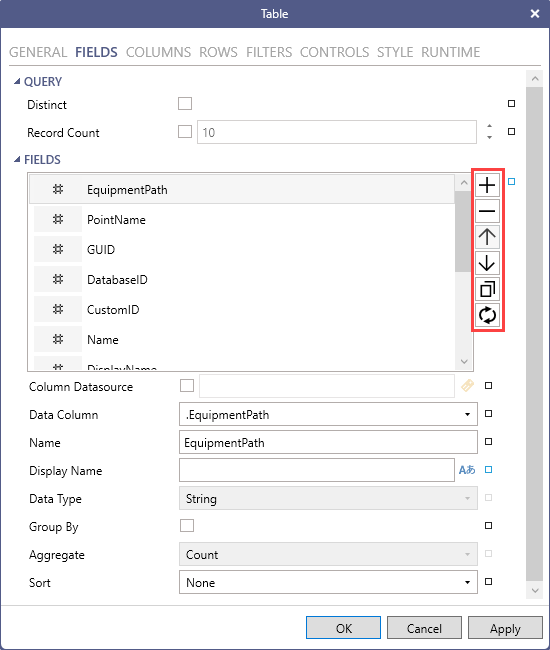
-
On the COLUMNS tab, click
next to the column list to load the columns available for your query. Optionally, customize the settings for each column as desired. Use the button menu to add, remove, or copy columns and change the order in which they appear in the table. -
Modify the remaining table settings as desired. When finished, click Apply and then OK to close the configuration.
-
Verify the settings by viewing the query in runtime. Use the options on the upper right of the GraphWorX screen to switch to the runtime mode
 or to open the display in a web browser
  .
.