MELFA Template Display Specifications
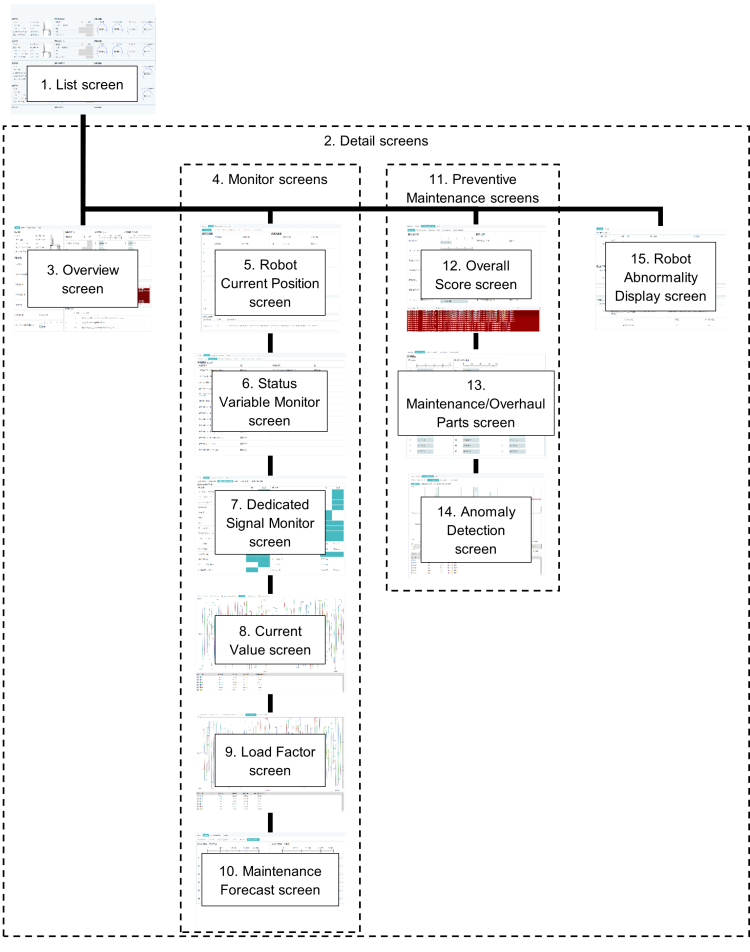
MELFA Template Version 1 consists of a list screen and detail screens. The images of each screen are shown below.
Screen Specifications
|
No. |
Items |
File Format |
Description |
||
|---|---|---|---|---|---|
|
1. |
List screen |
GDFX |
Displays a list of connected robots. [File Name] listing.gdfx |
||
|
2. |
Detail screens |
GDFX |
Displays details of the selected robot. [File Name] equipment_detail.gdfx |
||
|
3. |
|
Overview screen |
GDFX |
Displays the main monitoring items for the robot. [File Name] overview.gdfx |
|
|
4. |
Monitor screens |
GDFX |
Monitors the current robot status. [File Name] monitor.gdfx |
||
|
5. |
|
Robot Current Position screen |
GDFX |
Displays the current position of each axis of the robot. [File Name] monitor.gdfx |
|
|
6. |
Status Variable Monitor screen |
GDFX |
Displays the robot’s internal variable data. [File Name] monitor.gdfx |
||
|
7. |
Dedicated Signal Monitor screen |
GDFX |
Displays the robot’s dedicated input/output signals (I/O). [File Name] monitor.gdfx |
||
|
8. |
Current Value screen |
GDFX |
Displays the current values of each robot axis. [File Name] Current.gdfx |
||
|
9. |
Load Factor screen |
GDFX |
Displays the load rate of each axis of the robot. [File Name] LoadRatio.gdfx |
||
|
10. |
Maintenance Forecast screen |
GDFX |
Displays the available grease time and drive belt time for each robot axis. [File Name] monitor.gdfx |
||
|
11. |
Preventive Maintenance screens |
GDFX |
A screen related to the robot’s preventive maintenance and predictive maintenance functions. [File Name] PreventiveMaintenance.gdfx |
||
|
12. |
|
Overall Score screen |
GDFX |
Displays the overall scores of maintenance parts and overhaul parts calculated by the robot controller’s wear calculation function, as well as various accumulated times and numbers of calculations. [File Name] PreventiveMaintenance.gdfx |
|
|
13. |
Maintenance/ Overhaul Parts screen |
GDFX |
Displays the wear rate of maintenance parts and overhaul parts calculated by the robot controller’s wear rate calculation function. [File Name] PreventiveMaintenance.gdfx |
||
|
14. |
Anomaly Detection screen |
GDFX |
Displays the anomaly detection scores for the reducer, encoder data, and encoder communication, calculated by the robot controller’s anomaly detection function. [File Name] AbnormalityDetection.gdfx |
||
|
15. |
Robot Abnormality Display screen |
GDFX |
Displays any currently occurring errors obtained from the robot controller. [File Name] equipment_detail.gdfx |
||
The configuration and image of each screen are shown below.
List Screen
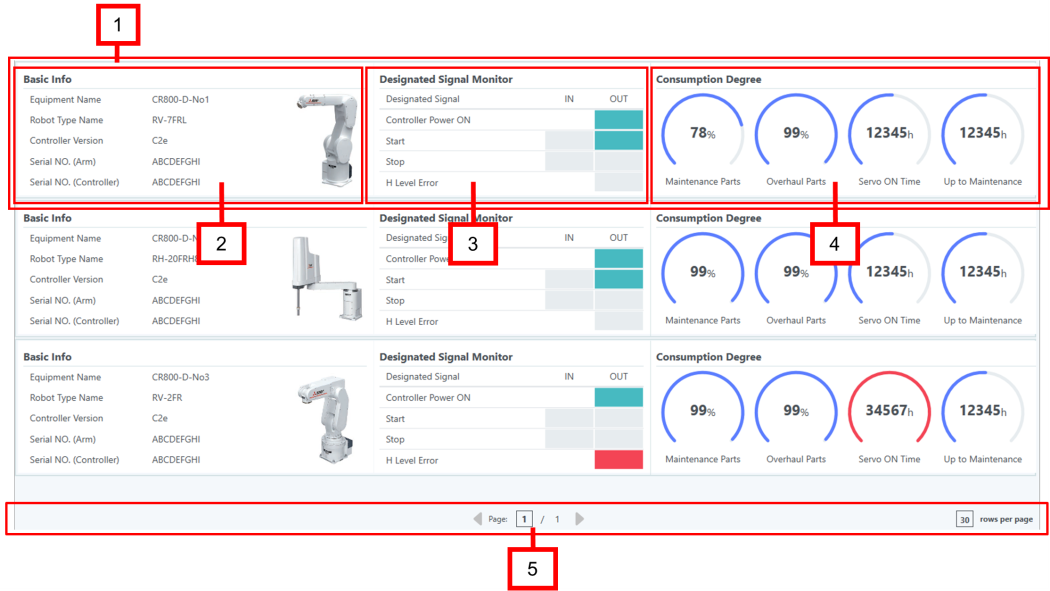
The List screen displays a list of connected robots. The screen image and configuration are shown below.
|
No. |
Name |
Description |
|
|---|---|---|---|
|
1. |
Faceplate |
Shows an overview of the connected robot. |
|
|
2. |
|
Basic Info |
Displays basic information about the robot. |
|
3. |
Designated Signal Monitor |
Displays the dedicated signal of the robot. |
|
|
4. |
Consumption Degree |
Displays the wear level of each robot part. |
|
|
5. |
Navigation |
Navigates list view screen. |
|
Detail Screens
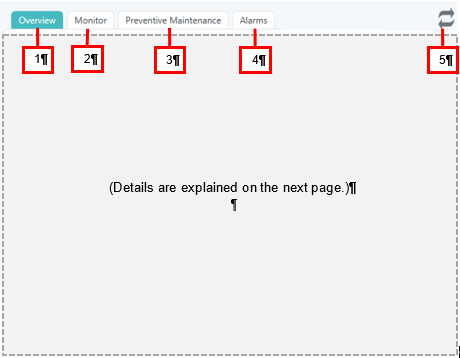
The Details screen transitions to the screen corresponding to the Overview, Trend, Monitor, Parameter, and Alarm tabs. The screen image and configuration are shown below.
|
No. |
Name |
Description |
|---|---|---|
|
1. |
Overview tab |
Loads the overview screen. |
|
2. |
Monitor tab |
Loads the robot’s current position screen. |
|
3. |
Preventive Maintenance tab |
Loads the overall score screen. |
|
4. |
Alarms tab |
Loads the robot error display screen. |
|
5. |
Refresh button |
When you click the button, the read request flag for the robot’s special tag is reset. Please refer to troubleshooting for details. |
Overview Screen
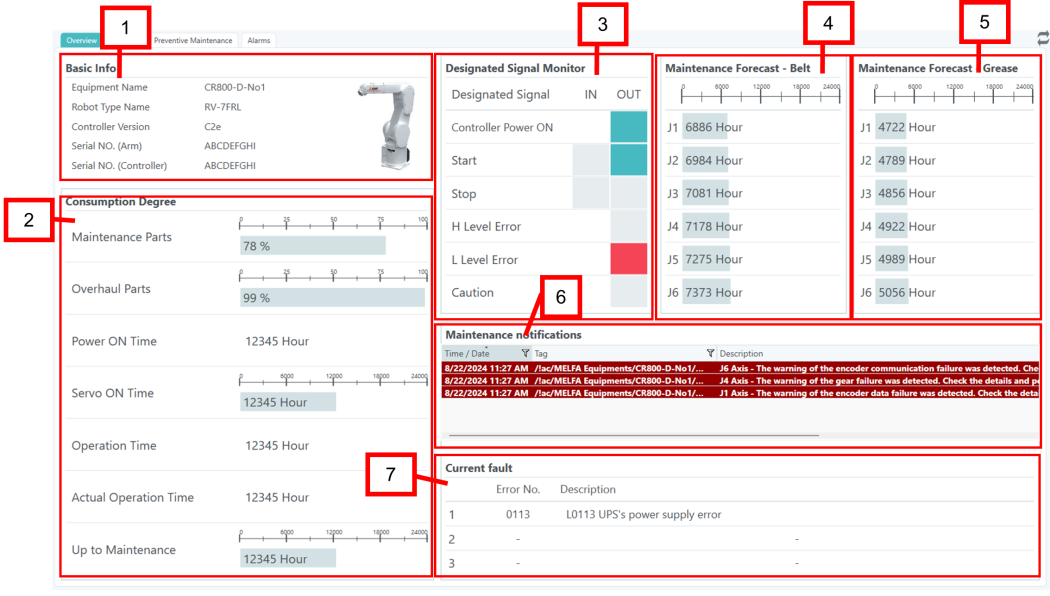
The Overview screen displays the main monitor items of the robot. The screen image and configuration are shown below.
|
No. |
Name |
Description |
|---|---|---|
|
1. |
Basic info |
Displays basic information about the robot. |
|
2. |
Consumption Degree |
Displays the wear level of each robot part. It is only displayed when the robot’s preventive maintenance function is enabled. If the robot’s preventive maintenance function is disabled, the Consumption Degree section of the screen is dimmed. |
|
3. |
Designated Signal Monitor |
Displays the dedicated signal of the robot. |
|
4. |
Maintenance Forecast - Belt |
Displays the available belt time for J1 to J6. It is only displayed if the robot’s preventive maintenance function is disabled. If the If the robot’s preventive maintenance function is enabled, this section of the screen is dimmed. |
|
5. |
Maintenance Forecast - Grease |
Displays the available grease time for J1 to J6. It is only displayed if the robot’s preventive maintenance function is disabled. If the robot’s preventive maintenance function is enabled, this section of the screen is dimmed. |
|
6. |
Maintenance notifications |
Displays a list of warnings when the wear level, wear condition, or anomaly detection score that is calculated by the robot controller meets the warning criteria. It is only displayed when the robot’s predictive maintenance function is enabled. If the robot’s preventive maintenance function is disabled, this section of the screen is dimmed. |
|
7. |
Current fault |
Displays the current errors (up to the latest 3) retrieved from the robot controller. |
Monitor Screens
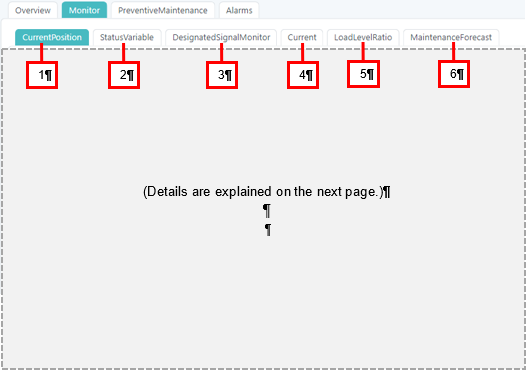
The Monitor screen is a screen where you can transition to the corresponding screen by clicking the various tabs. The screen image and configuration are shown below.
|
No. |
Name |
Description |
|---|---|---|
|
1. |
CurrentPosition tab |
Loads the robot’s current position screen. |
|
2. |
StatusVariable tab |
Loads the state variable monitor screen. |
|
3. |
DesignatedSignalMonitor tab |
Loads the dedicated signal monitor screen. |
|
4. |
Current tab |
Loads the current value screen. |
|
5. |
LoadLevelRatio tab |
Loads the load rate screen. |
|
6. |
MaintenanceForecast |
Loads the maintenance forecast screen. |
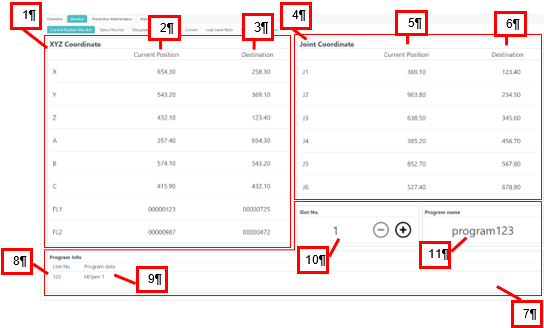
Robot Current Position Screen
The Robot Current Position screen displays the current position of the robot in each coordinate system. The screen image and configuration are shown below.
|
No. |
Name |
Description |
|
|---|---|---|---|
|
1. |
XYZ Coordinate |
Displays the current position and destination position (position at which movement is completed) for each axis. The meaning of each item’s value is as follows:
|
|
|
2. |
|
Current Position |
Displays the current position of the robot obtained from the robot controller. |
|
3. |
Destination |
Displays the destination position of the running program, obtained from the robot controller. |
|
|
4. |
Joint Coordinate |
Displays the current position and destination position (movement completion position) of each axis. J1 to J6 axes: angle units |
|
|
5. |
|
Current Position |
Displays the current position of the robot obtained from the robot controller. |
|
6. |
Destination |
Displays the destination position of the running program, obtained from the robot controller. |
|
|
7. |
Program Info |
Displays the line number and instruction of the currently running program. |
|
|
8. |
|
Line No. |
Displays the line number of the currently running program that is retrieved from the robot controller. |
|
9. |
Program data |
Displays the currently executing instruction that is retrieved from the robot controller. |
|
|
10. |
Slot No. |
Specifies the slot number to retrieve the currently executing robot program. |
|
|
11. |
Program name |
Displays the name of the currently executing robot program that is retrieved from the robot controller. |
|
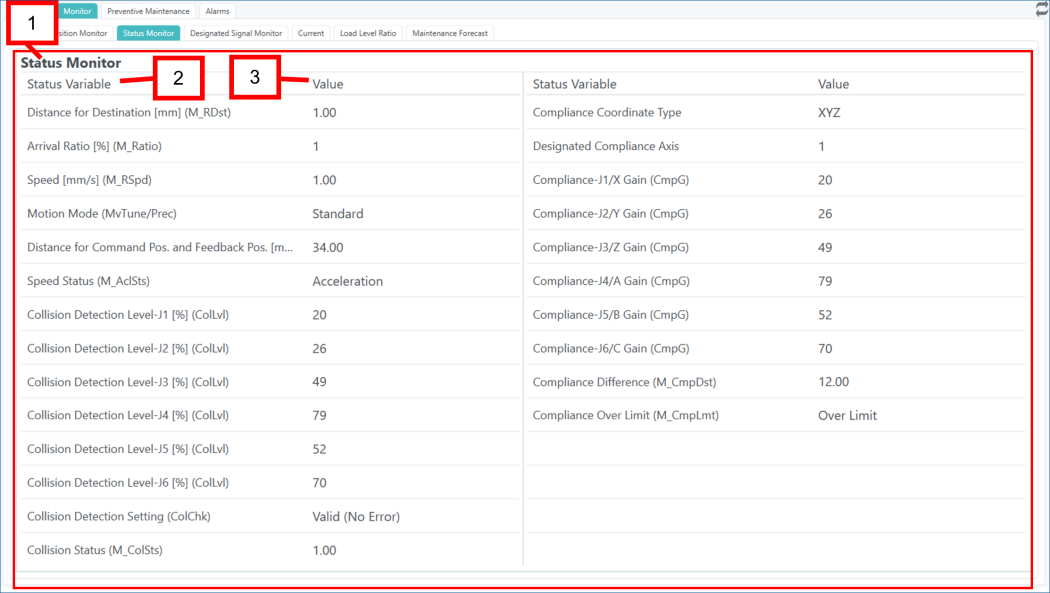
Status Variable Monitor Screen
The State Variable Monitor screen displays the internal variables of the robot. The screen image and configuration are shown below.
|
No. |
Name |
Description |
|
|---|---|---|---|
|
1. |
Status Monitor |
Displays the robot’s internal variables. |
|
|
2. |
|
Status Variable |
Displays the variable name. |
|
3. |
Value |
Displays the value of a variable. |
|
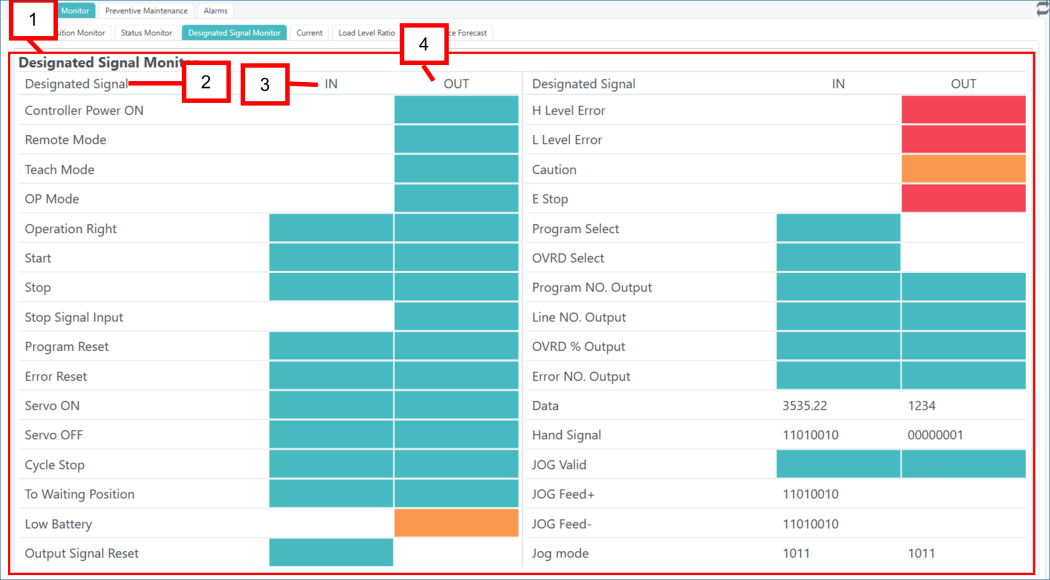
Dedicated Signal Monitor Screen
The Dedicated Signal Monitor screen displays the dedicated input signals (I/O) of the robot. The screen image and configuration are shown below.
|
No. |
Name |
Description |
|
|---|---|---|---|
|
1. |
Designated Signal Monitor |
Displays the dedicated input signals (I/O) of the robot. |
|
|
2. |
|
Designated Signal |
Displays the dedicated signal name. |
|
3. |
IN |
Displays the status of the IN signal of the robot controller. |
|
|
4. |
OUT |
Displays the status of the OUT signal of the robot controller. |
|
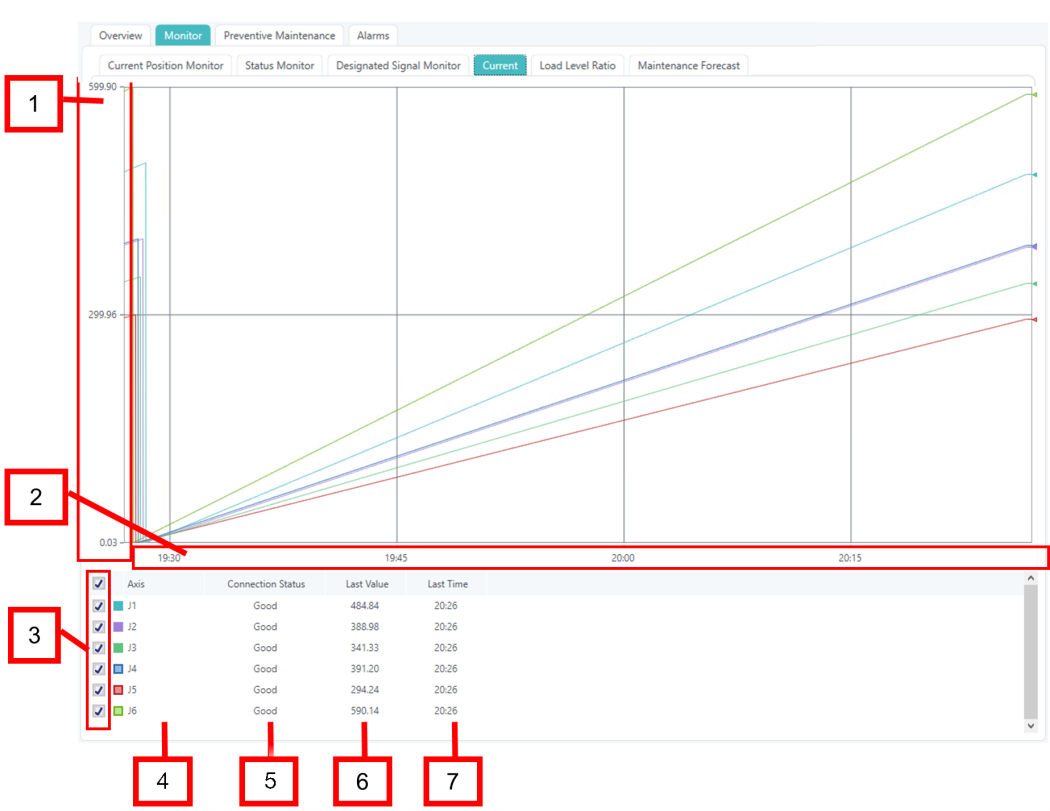
Current Value Screen
The Current Value screen displays the current value of each axis of the robot. The screen image and configuration are shown below.
|
No. |
Name |
Description |
|---|---|---|
|
1. |
Current value (Y axis) |
Displays the current feedback value obtained from the robot controller. |
|
2. |
Current time (X axis) |
Displays a graph from the current time to the set time range. Default: 1 hour |
|
3. |
Check boxes (J1 to J6) |
Select the monitor item to display in the graph. Selected: Displays the graph corresponding to the display target. Unselected: Hides the graph corresponding to the display target. |
|
4. |
Axis |
Displays the names of J1 to J6. |
|
5. |
Connection Status |
Displays the connection status. [Good/Bad] |
|
6. |
Last Value |
Displays the most recent value. |
|
7. |
Last Time |
Displays the time when the most recent value was obtained. |
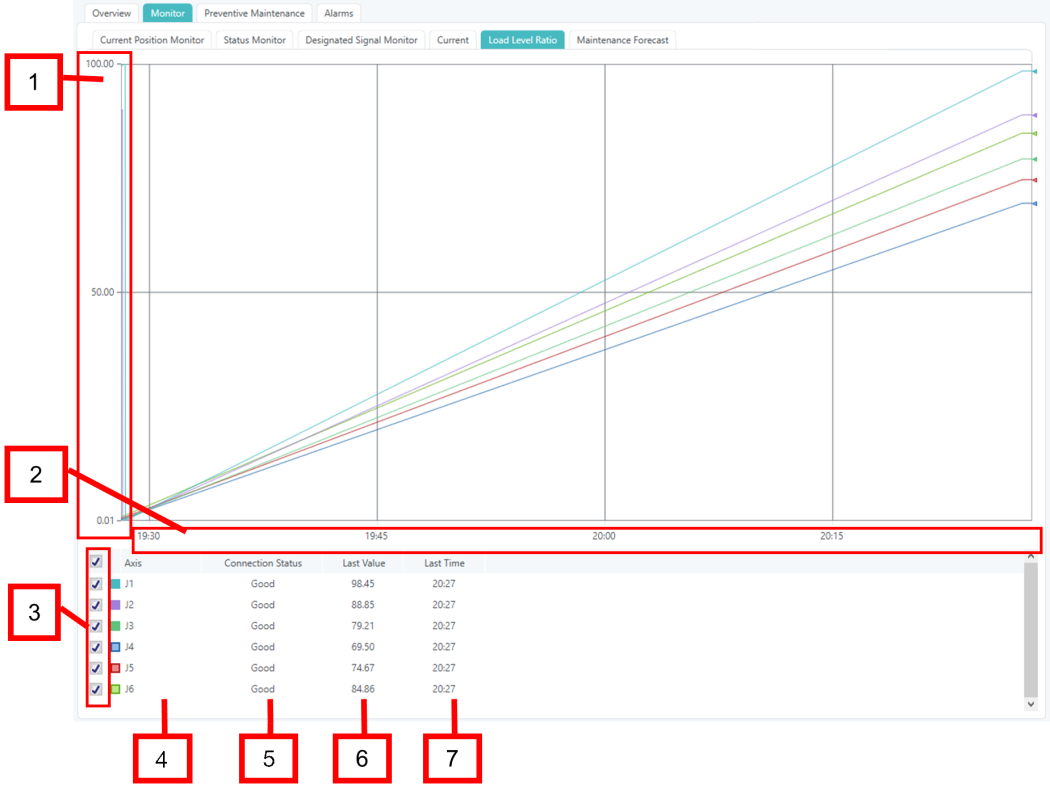
Load Factor Screen
The Load Factor screen displays the load factor of each axis of the robot. The screen image and configuration are shown below.
|
No. |
Name |
Description |
|---|---|---|
|
1. |
Load factor (Y axis) |
Displays the axis load level value obtained from the robot controller. |
|
2. |
Current time (X axis) |
Displays the graph from the current time to the set time range. Default: 1 hour |
|
3. |
Check boxes (J1 to J6) |
Select the monitor items to display in the graph. Selected: Displays the graph corresponding to the display item. Unselected: Hides the graph corresponding to the display item. |
|
4. |
Axis |
Displays the names of J1 to J6. |
|
5. |
Connection Status |
Displays the connection status. [Good/Bad] |
|
6. |
Last Value |
Displays the most recent value. |
|
7. |
Last Time |
Displays the time when the most recent value was obtained. |
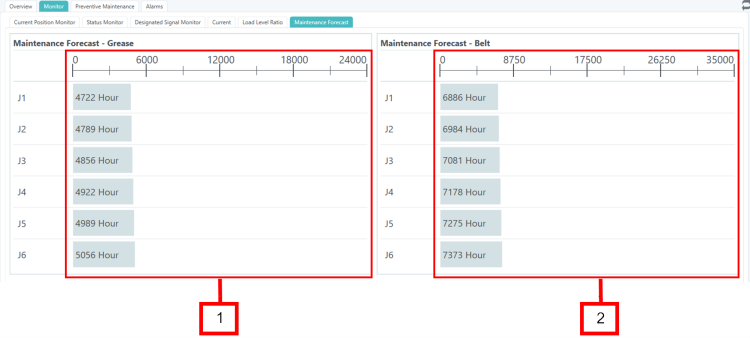
Maintenance Forecast Screen
The Maintenance Forecast screen displays the remaining time for grease and the remaining time for the drive belt for each axis of the robot. The screen image and configuration are shown below.
|
No. |
Name |
Description |
|---|---|---|
|
1. |
Maintenance Forecast - Grease |
Displays the remaining grease time for each axis (J1 to J6) obtained from the robot controller. |
|
2. |
Maintenance Forecast - Belt |
Displays the available belt time for each axis (J1 to J6) obtained from the robot controller. |
Preventive Maintenance Screens
The Preventive Maintenance screen is a screen that transitions to the corresponding screen when you click various tabs. It is displayed only when the robot’s preventive maintenance function is enabled and it is dimmed when it is disabled. The screen image and configuration are shown below.
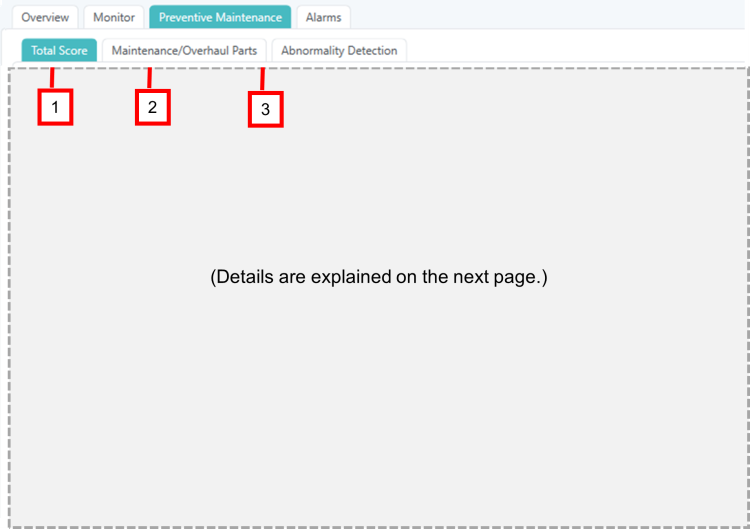
Preventive Maintenance Screens Configuration
|
No. |
Name |
Description |
|---|---|---|
|
1. |
Total Score tab |
Loads the overall score screen. |
|
2. |
Maintenance/Overhaul Parts tab |
Loads the maintenance/overhaul parts screen. |
|
3. |
Abnormality Detection tab |
Loads the anomaly detection screen. |
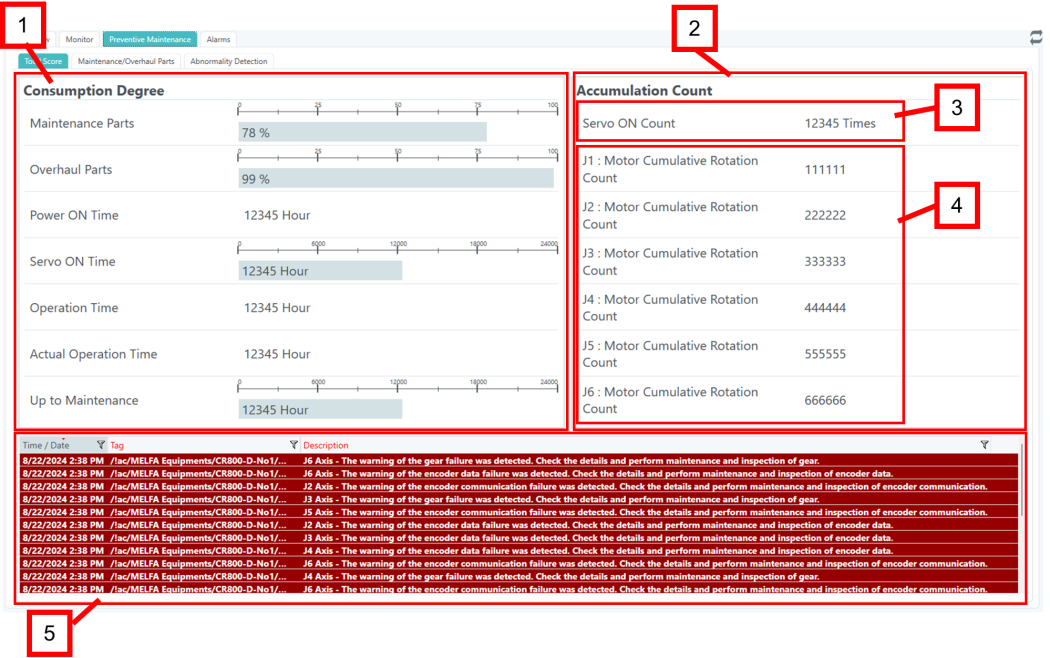
Overall Score Screen
The Overall Score screen displays the overall scores of the maintenance parts and overhaul parts calculated by the robot controller’s wear calculation function, as well as the various accumulated times and accumulated counts. The screen image and configuration are shown below.
|
No. |
Name |
Description |
|
|---|---|---|---|
|
1. |
Consumption Degree |
Displays the wear level of each robot part. |
|
|
2. |
Accumulation Count |
Displays the number of times the servo is ON and the total number of motor revolutions for each axis. |
|
|
3. |
|
Servo ON Count |
Displays the number of servo ON times retrieved from the robot controller. [times] |
|
4. |
Motor Cumulative Rotation Count |
Displays the total number of motor rotation points for each axis obtained from the robot controller. |
|
|
5. |
Maintenance notification alarm |
When the wear level, wear state, or abnormality detection score calculated by the robot controller meets the conditions for generating a warning, a list of warnings is displayed. |
|
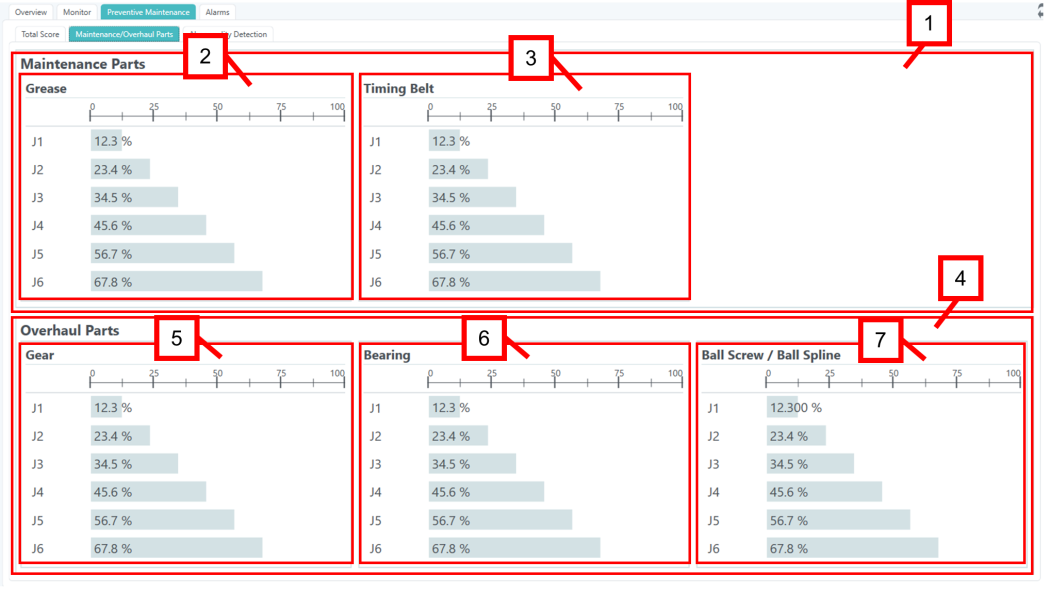
Maintenance/Overhaul Parts Screen
The Maintenance/Overhaul Parts screen displays the wear rate of maintenance parts and overhaul parts calculated by the robot controller’s wear rate calculation function. The screen image and configuration are shown below.
|
No. |
Name |
Description |
|
|---|---|---|---|
|
1. |
Maintenance Parts |
Displays the wear level of each maintenance part and each joint axis (J1 to J6) as graphs and numerical values [%]. |
|
|
2. |
|
Grease |
Displays the degree of grease wear obtained from the robot controller. |
|
3. |
Timing Belt |
Displays the degree of timing belt wear obtained from the robot controller. |
|
|
4. |
Overhaul Parts |
Displays the wear level of each overhaul part and each joint axis (J1 to J6) as graphs and numerical values [%]. |
|
|
5. |
|
Gear |
Displays the wear level of the reducer obtained from the robot controller. |
|
6. |
Bearing |
Displays the bearing wear level obtained from the robot controller. |
|
|
7. |
Ball Screw / Ball Spline |
Displays the wear level of the ball screw/ball spline obtained from the robot controller. |
|
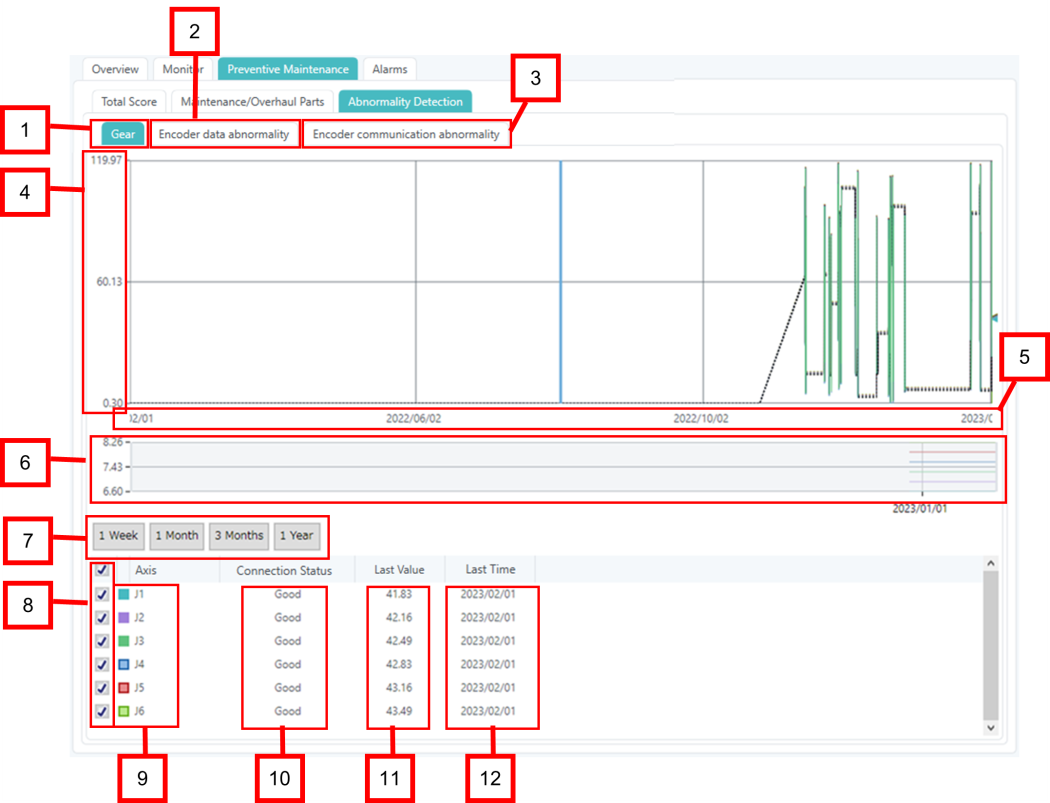
Anomaly Detection Screen
The Anomaly Detection screen displays the scores of anomaly detection for the reducer, encoder data, and encoder communication calculated by the robot controller’s anomaly detection function. The screen image and configuration are shown below.
|
No. |
Name |
Description |
|---|---|---|
|
1. |
Gear tab |
Loads the reducer abnormality detection screen. |
|
2. |
Encoder data abnormality tab |
Loads the encoder data error detection screen. |
|
3. |
Encoder communication abnormality tab |
Loads the encoder communication error detection screen. |
|
4. |
Score (Y axis) |
Displays the anomaly detection score value obtained from the robot controller. |
|
5. |
Date and Time (X axis) |
Displays a graph from the current time to the set time range. Initial display: 1 year |
|
6. |
Summary view |
You can change the display period of the graph by sliding the cursor. |
|
7. |
Range selection |
You can adjust the graph display period by clicking the period selection button. Available periods: 1 week, 1 month, 3 months, 1 year |
|
8. |
Check boxes (J1 to J6) |
Select the monitor items to display in the graph. Selected: Displays the graph corresponding to the display item. Unselected: Hides the graph corresponding to the display item. |
|
9. |
Axis |
Displays the names of J1 to J6. |
|
10. |
Connection Status |
Displays the connection status. [Good/Bad] |
|
11. |
Last Value |
Displays the most recent value. |
|
12. |
Last Time |
Displays the time when the most recent value was obtained. |
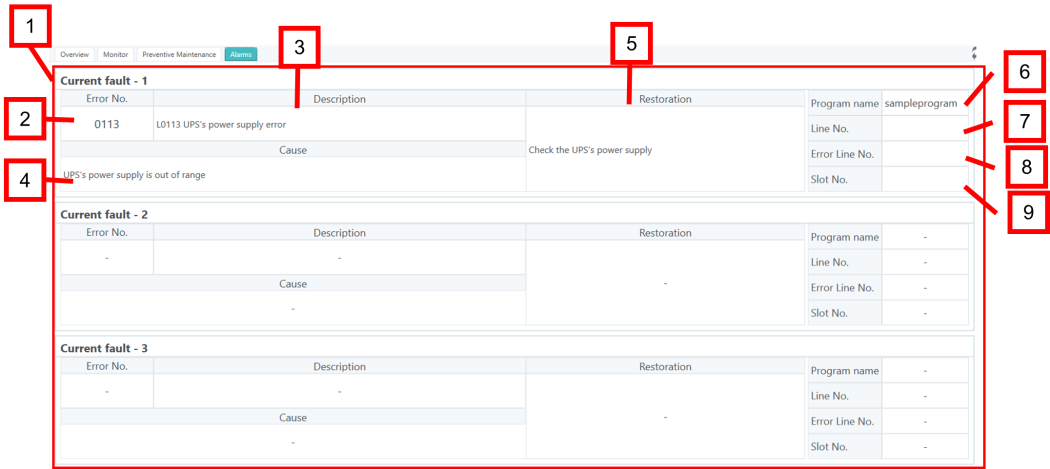
Robot Abnormality Display Screen
The Robot Abnormality Display screen displays any errors currently occurring, obtained from the robot controller. The screen image and configuration are shown below.
|
No. |
Name |
Description |
|
|---|---|---|---|
|
1. |
Current fault (1 to 3) |
Displays the currently occurring errors (up to 3) stored in the robot, obtained from the robot controller. |
|
|
2. |
|
Error No. |
Displays the currently occurring error number obtained from the robot controller. |
|
3. |
Description |
Displays the error message corresponding to the error number currently occurring in the Asset equipment property formula. Displays "- (Unknown Error)" if the error number is unknown. For details on error messages, refer to the "CR800 Series Controller Instruction Manual Troubleshooting." |
|
|
4. |
Cause |
Displays the cause corresponding to the error number currently occurring in the Asset equipment property formula. Displays "-" if the error number is unknown. For details on the cause, refer to the "CR800 Series Controller Instruction Manual Troubleshooting." |
|
|
5. |
Restoration |
Displays the solution corresponding to the error number currently occurring in the Asset device property formula. Displays "-" if the error number is unknown. For details on solutions, refer to the "CR800 Series Controller Instruction Manual Troubleshooting." |
|
|
6. |
Program name |
Displays the name of the program in which the error occurred, obtained from the robot controller. |
|
|
7. |
Line No. |
Displays the line number of the program where the error occurred, obtained from the robot controller. |
|
|
8. |
Error Line No. |
Displays the detailed number of the currently occurring error obtained from the robot controller. |
|
|
9. |
Slot No. |
Displays the slot number of the program where the error occurred, obtained from the robot controller. |
|