Working with Energy AnalytiX Runtime Modules
For Energy AnalytiX to properly collect, calculate and display data the following services must be running.
-
AssetWorX Point Manager
-
Hyper Historian Logger service
-
Energy AnalytiX service
-
AnalytiX-BI point manager
-
Triggers service
If there is a need to troubleshoot or debug runtime operations, then the specific areas of functionality and related runtime modules will need to be debugged separately.
Energy Data Collection, Data Logging and Energy Calculations
This task is fulfilled by Hyper Historian Logger service and the related diagnostic tools are:
-
TraceWorX for Hyper Historian Logger Manager module
-
Hyper Historian Calculation Analyzer
Hyper Historian TraceWorX support can reveal issues with data collection or calculation processing
TraceWorX for Hyper Historian Logger Manager Module in Workbench
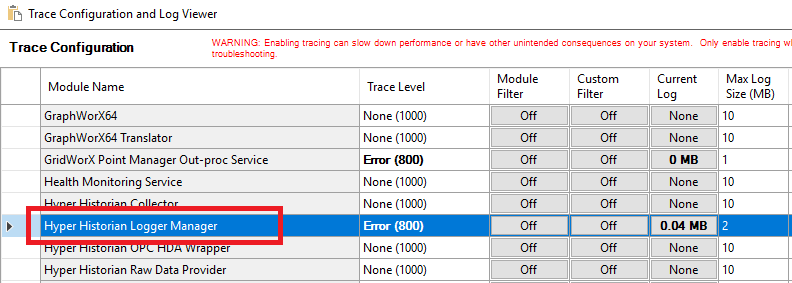
In addition, Hyper Historian Calculations Analyzer can be used to review and troubleshoot energy calculations evaluations (see "Hyper Historian Calculations Analyzer").
Hyper Historian Calculation Analyzer
Meter Data Spikes Repair and Energy Star Data Exports
This task is fulfilled by the Energy AnalytiX service and the related diagnostic tools are:
-
TraceWorX for Energy AnalytiX service
-
Monitor View in Workbench
Energy AnalytiX TraceWorX support can reveal issues with the processing of the previous tasks.
TraceWorX for Energy AnalytiX Service in Workbench

Energy AnalytiX Monitor View in Workbench can also offer valuable information regarding runtime processes.
Monitor View Node in Energy AnalytiX
The Monitor View node within Energy AnalytiX presents application-specific statistics so that users can see, at a glance, what the application is doing and what can be managed. In addition, if ever necessary, users can provide this information to ICONICS technical support for further guidance (see "Monitor View Node" topic).
Monitor View Node in Workbench
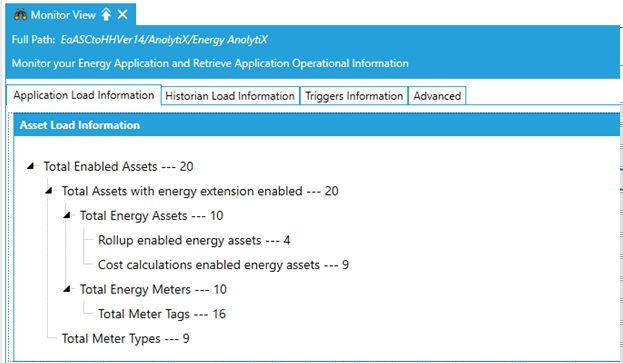
The Monitor View Node in Energy AnalytiX is comprised of multiple tabs, including:
-
Application Load Information
-
Historian Load Information
-
Triggers Information
-
Advanced
Runtime Processing of Meter Data Spikes Repair Tasks
When the Energy AnalytiX service is running, it will constantly poll the configuration database for meter data spikes repair tasks (see 'Meter Data Spikes Repair"). If a task is found, it will be processed by the runtime as follows:
-
All scheduled meter data repair tasks will be processed one by one, in the order they were assigned
-
Runtime will read from the database all related information including the search and filtering criteria for selecting the specific meter data repair value (spike)
Energy AnalytiX runtime, in attempting to repair a meter data spike will
-
Retrieve all raw meter data consumption values for the base summary interval of the meter data spike consumption value
-
Then, it will try to repair the meter data spike by analyzing if the highest sub-consumption event in the base summary period can be adjusted
-
If not, it will adjust, based on meter counter type, all the individual consumption events that within the base summary period
Once all individual raw meter data readings adjustments have been made, the runtime will estimate the updated base summary consumption value.
-
If the estimated base summary consumption value is more than 25% greater than the “ideal” base summary consumption value it will abort the attempt
-
If the alternate method also fails to repair the meter data spike, the entire task will be aborted.
-
If any of the methods succeeds, the runtime will write back the updated raw meter data consumption values to Hyper Historian.
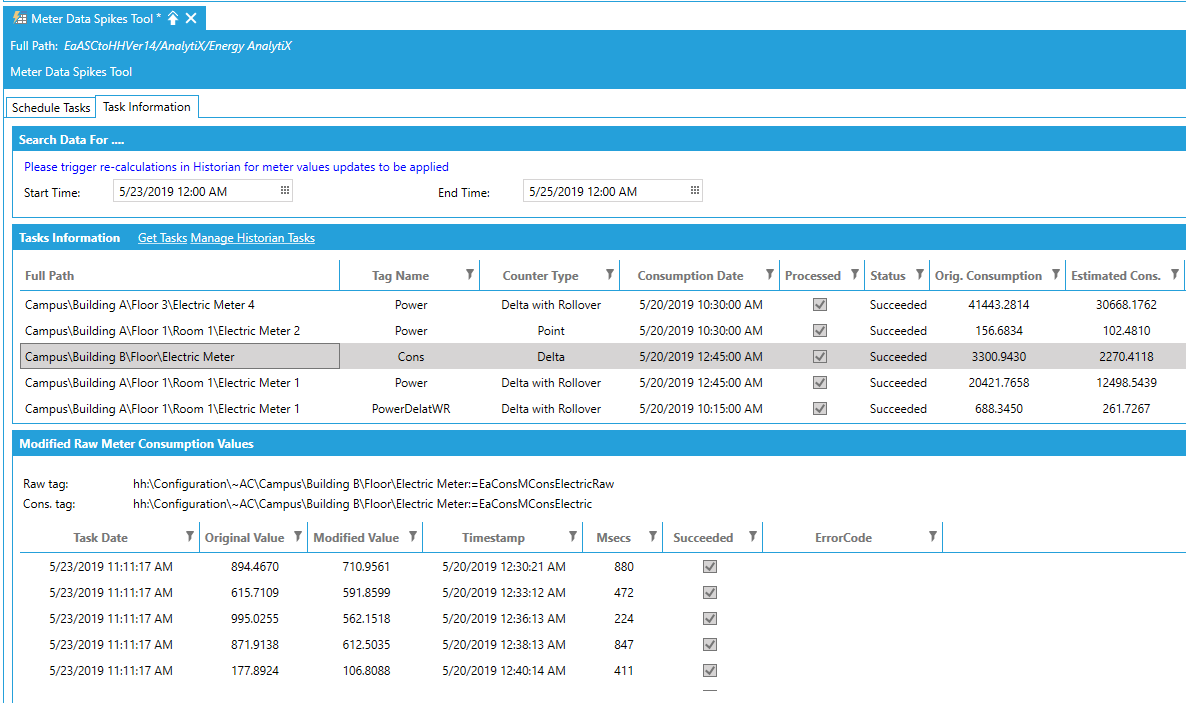
All the activity can be monitored from the same Workbench form – Tasks Information tab. The tab will display all related consumption values, as well as all related diagnostics. It will also display which raw meter data values are replaced inside Hyper Historian.
Monitoring Meter Data Spikes Repairs in Workbench
Export of Energy Star Formatted Data
Energy AnalytiX supports the periodic or on-demand data extracts to the AssetWorX database of Energy Star enabled energy meter consumption data (see "Energy Star").
Periodic Energy Star Data Periodic Extracts in Workbench
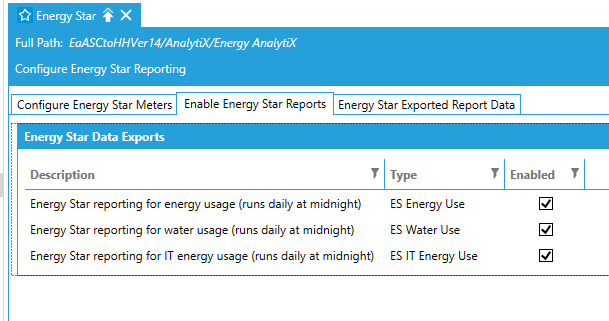
This can be accomplished using the Enable Energy Star Reports tab in the Energy Star node in Workbench. If the report option is enabled, Energy AnalytiX service will be periodically exporting meter consumption data to the following tables in the AssetWorX database:
-
Energy Use Report
-
EaASC_ESEnergyUse
-
Water Use Report
-
EaASC_ESWaterUse
-
IT Energy Use Report
-
EaASC_ESITEnergyUse
All Energy Star data exports will run periodically based on a pre-defined daily periodic trigger running at the beginning of the day with a reasonable trigger time delay to allow for all energy calculation to be completed in Hyper Historian.
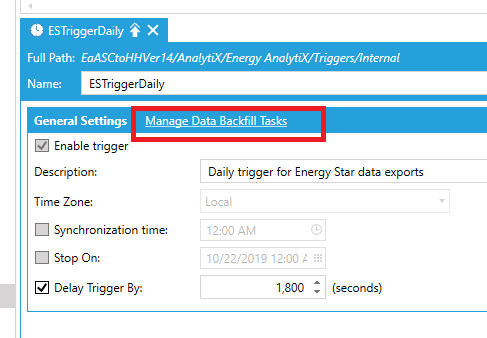
Energy AnalytiX supports the on-demand data extracts to the AssetWorX database of Energy Star enabled energy meter consumption data. This can be accomplished using the pre-defined daily periodic trigger ESTRiggerDaily and clicking on the Manage Data Backfill Tasks link.
Configuring On Demand Energy Star Data Extracts in Workbench
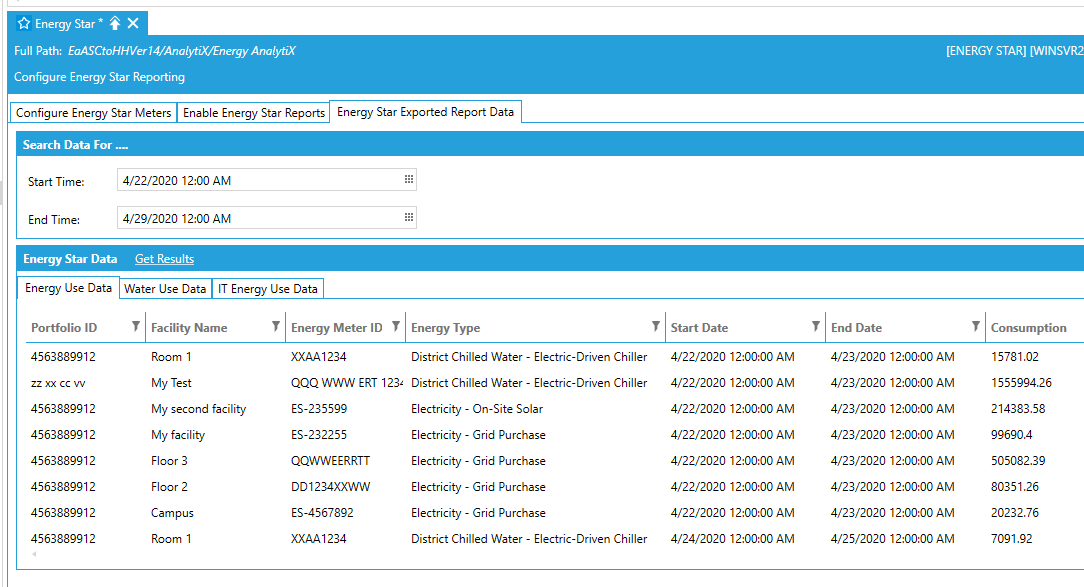
The user can pre-view exported Energy Star data by using the Energy Star Exported Report Data under the Energy Star node in the Workbench.
Viewing Periodic Energy Star Data Extracts in Workbench
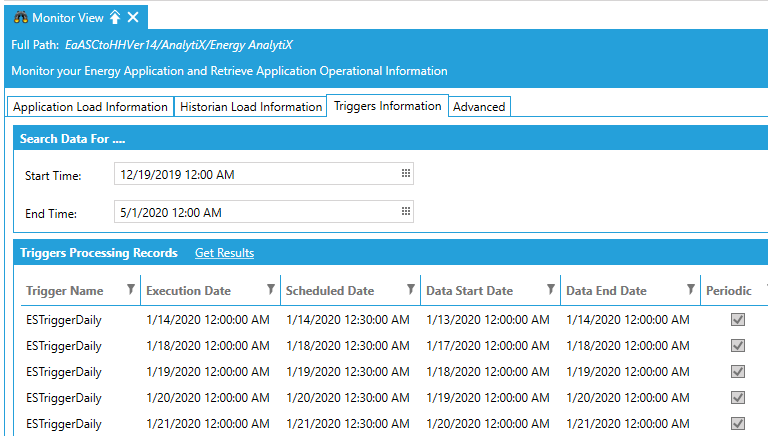
The Triggers Information tab provides information relating to periodic trigger execution tasks including the Energy Star data extracts.
Triggers Information in Workbench
Energy Dashboard and Visualization
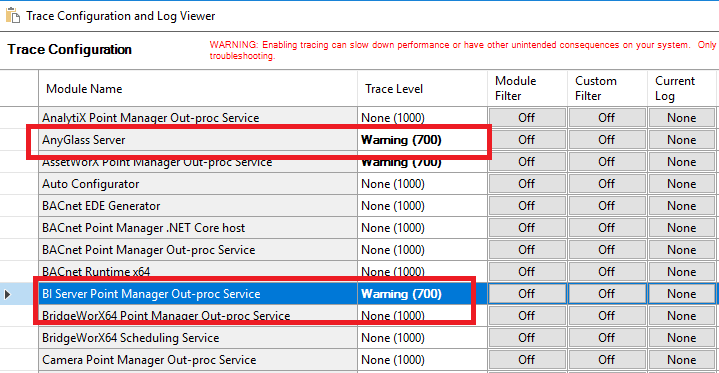
Energy AnalytiX ships with a default energy dashboard based on AnalytiX-BI and KPIWorX-BI. Enabling TraceWorX on the above modules can help in troubleshooting visualization related issues (see "AnalytiX-BI", "KPIWorX-BI", and "Energy Dashboard").
TraceWorX Settings for Energy Visualization
See Also:
How Energy AnalytiX Runtime Works