Monitor View Node in Energy AnalytiX
The Monitor View node within Energy AnalytiX presents application-specific statistics so that users can see, at a glance, what the application is doing and what can be managed. In addition, if ever necessary, users can provide this information to ICONICS technical support for further guidance.
Monitor View Node in Energy AnalytiX
The Monitor View Node in Energy AnalytiX is comprised of multiple tabs, including:
Application Load Information Tab
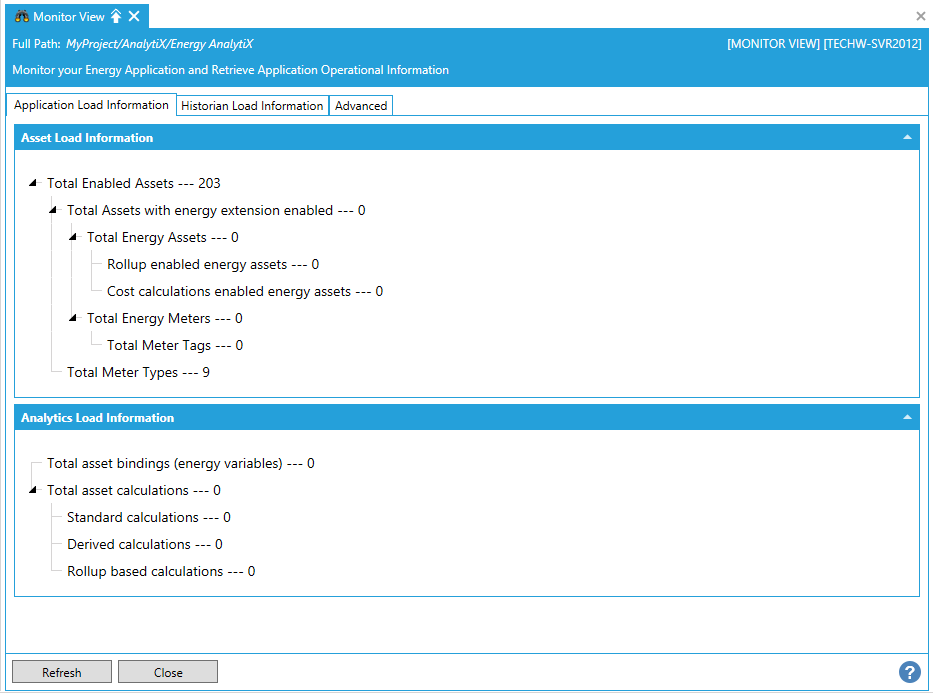
Application Load Information Tab in the Monitor View Node in Energy AnalytiX
The Application Load Information tab provides the following information:
Asset Load Information
-
Total Enabled Assets
-
Total Assets with energy extension enabled
-
Total Energy Assets
-
Rollup enabled energy assets
-
Cost calculations enabled energy assets
-
Total Energy Meters
-
Total Meter Tags
-
Dynamic meter tags
-
Total Meter Types
Analytics Load Information
-
Total asset bindings (energy variables)
-
Total asset calculations
-
Standard calculations
-
Derived calculations
-
Rollup based calculations
Historian Load Information Tab
Historian Load Information Tab in the Monitor View Node in Energy AnalytiX
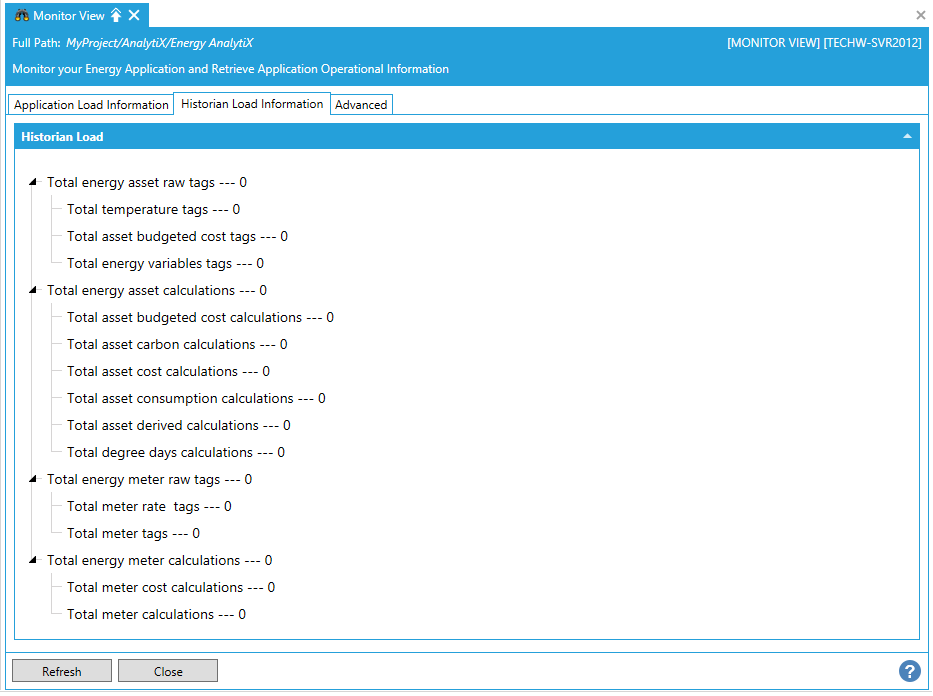
The Historian Load Information tab provides the following information regarding the utilized Hyper Historian raw tags, as well as the performance calculations:
-
Total energy asset raw tags
-
Total temperature tags
-
Total asset budgeted cost tags
-
Total energy variables tags
-
Total energy asset calculations
-
Total asset budgeted cost calculations
-
Total asset carbon calculations
-
Total asset cost calculations
-
Total asset consumption calculations
-
Total asset derived calculations
-
Total degree days calculations
-
Total energy meter raw tags
-
Total meter rate tags
-
Total energy meter calculations
-
Total meter cost calculations
-
Total meter calculations
Triggers Information
The Triggers Information tab provides information relating to periodic trigger execution tasks.
Triggers Information Tab in the Monitor View Node in Energy AnalytiX
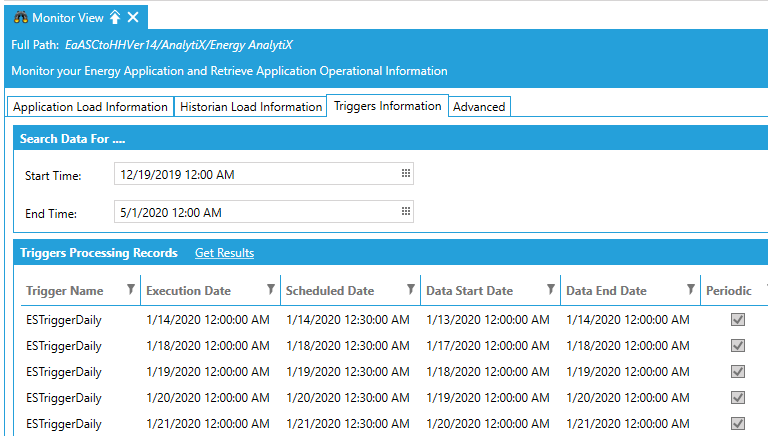
Search Data For ...
-
Start Time - Enter a start time, including date and time of day, in the text entry form or click on the calendar tool button to make your settings.
-
End Time - Enter an end time, including date and time of day, in the text entry form or click on the calendar tool button to make your settings.
Triggers Processing Records
-
Get Results - Click this link to get the results according to the time settings you set above. Information returned includes Trigger Name, Execution Data, Schedule Date, Data Start Date, Data End Date, and whether or not the trigger is Periodic.
Advanced
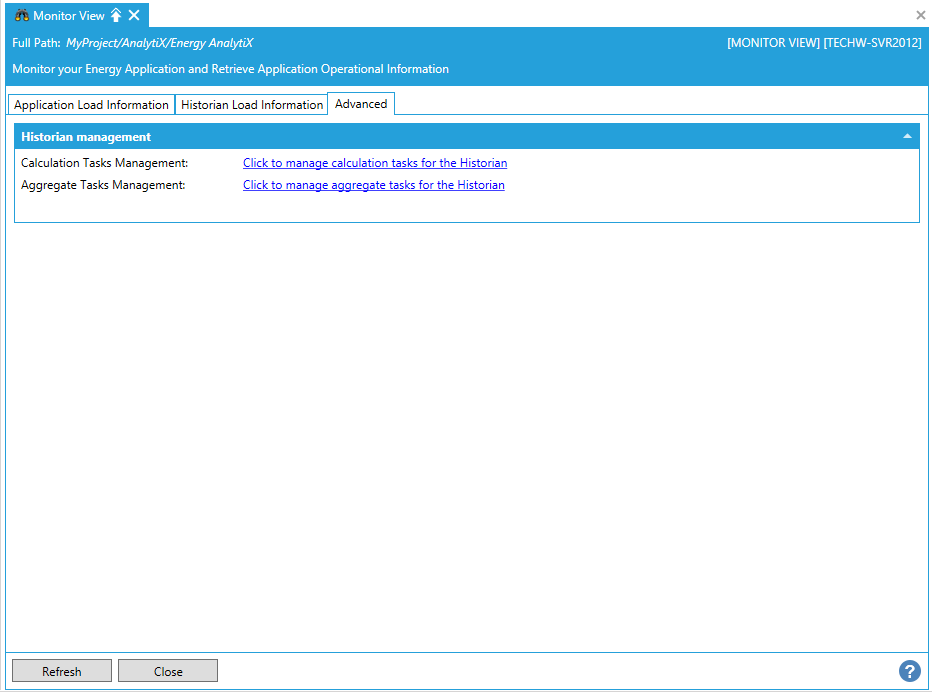
Advanced Tab in the Monitor View Node in Energy AnalytiX
-
Calculation Tasks Management - Click on the Click to manage calculations tasks for the Historian link, which opens the Calculation Tasks Management properties in ICONICS Hyper Historian.
-
Aggregate Tasks Management - Click on the Click to manage aggregate tasks for the Historian link, which opens the Aggregate Tasks Management properties in ICONICS Hyper Historian.
When you have completed updating setting in the Monitor View, click on the Close button to return to the Workbench.
See Also: