About AlertWorX
AlertWorX enhances ICONICS products by providing alert notification. It provides simple and easy to use configuration of notifications that can be sent via email and SMS/texting. It also provides reporting (via GenEvents), supports multiple data sources and integrates will all ICONICS applications.
AlertWorX Architecture
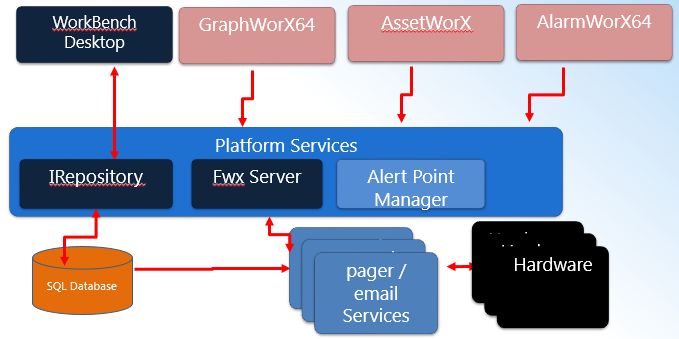
AlertWorX differs from ICONICS AlarmWorX Multimedia in that it currently provides centralized configuration for email and alerts. AlertWorX can also handle OPC and OPC UA Data Triggers and Commanding Triggers.
AlertWorX is configured through the Workbench, as shown below.
AlertWorX Provider Selected in the Workbench
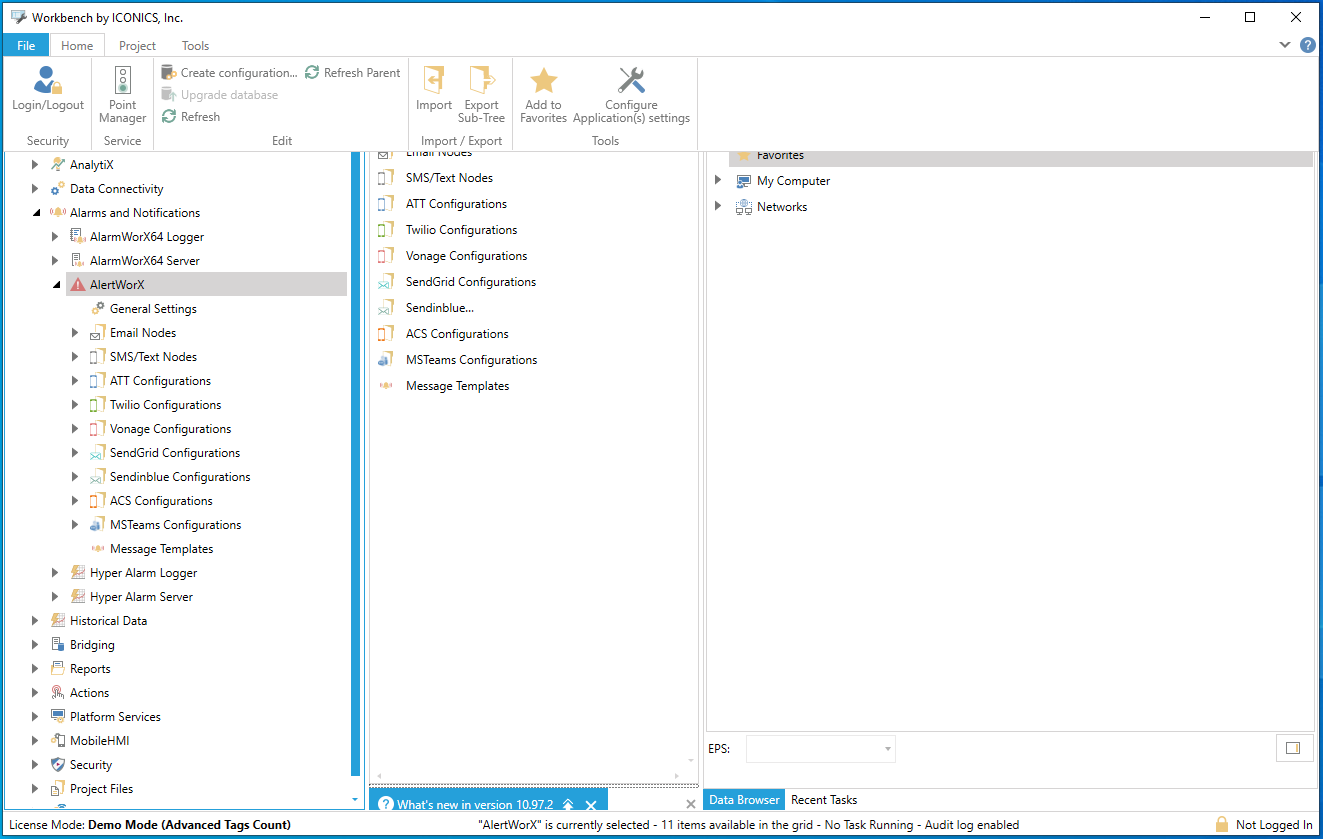
Users can expand the Configurations node in order to configure notifications.
AlertWorX Communication
AlertWorX supports three types of input communication: Commands, FrameWorX Alarm Communication, and OPC UA data. Commanding supports a simple-to-configure trigger that is easy to tie to various ICONICS products. This makes it simple to trigger Alert actions from a GraphWorX64 push-button, a right-click in the AssetWorX tree view, or a right-click menu item in the alarm viewer.
Alternatively, AlertworX can trigger based on the contents of received alarm or event messages. This is configured via the standard real time subscription available in the ICONICS alarm viewer. One use of this method could be to handle notification of high importance alarm or event messages.
The final input communication method supported is OPC UA data. AlertWorX can be set up to read destination, subject and message data from OPC UA string data points. In addition, AlertWorX will trigger based on the value of the send UA point and report the result to the Status of the result in the OPC UA stats value. The expected use of UA triggers is to dynamically change information processed or as part of batch updates.
AlertWorX Process: Commanding
Alert Commands follow this process:
-
A command is sent from the client application to the AlertWorX point manager.
-
The point manager caches the received command.
-
The point manager will pull command requests off of the command cache and sets the appropriate command data points with the values received from the command.
-
The point manager triggers the service to process the command via causing the command send value to transition from 0 to 1.
-
The Alert Service caches the alert commands in a command specific cache.
-
The Alert Service then forces the send value to transition from 1 to 0 allowing new commands to be taken from the point manager command cache.
-
Periodically, the Alert Service will take commands from the cache and process the alert action.
-
The Alert Service will write the status of the alert action to the command stats value.
Note: The alert command status is the status of the last command processed. It is not the status of the last command triggered. The two are only guaranteed to be the same if only one command is processed and there are no other commands in either the point manager or the alert service command queues.
Note: Alert Command points can be viewed in GraphWorX64.
Alert UA data follows this process:
-
UA data is updated.
-
The UA data send value transitions from 0 to 1.
-
The Alert Service reads and stores all UA data values at this time.
-
The Alert Service performs the action based on the stored UA data.
-
The Alert Service writes the status of the UA update to the UA status point.
-
The Alert Service then forces the send value to transition from 1 to 0, allowing UA data to trigger a new operation.
Note: There is no UA alert queue. As long as the send value is 0, the UA status field contains the status of the UA previous update.
Alert alarm & event data follow this process:
-
An update is received.
-
The Alert Service caches the update in an alarm & event specific cache.
-
Periodically, the Alert Service will take commands from the cache and process the alert action.
Notification of Action
Prior to performing an action, the alert service will post an event describing the destination of the action and some indication of the trigger of the action. After performing an action, the alert service will post an event describing the destination of the action, some indication of the trigger of the action, and the result of the action.
Note: This event information can be displayed in an alarm viewer with event subscription or logged via the alarm logger
Note: The alert services will not process events triggered by themselves
Status Results
When possible, the system will report the status of alert action. This status is the result as known by the service in question and is in no way guaranteed to represent the final throughput result. There are expected cases where the alert services will report a sent success status and the result is actually a failure. These represent cases where the failure results are withheld from the service or are not known at the time of reporting the status. For example, a common email security mechanism is to withhold reporting of invalid email addresses. When an invalid email address is sent to a mail exchange, the exchange will report success on processing the email and drop the email.
Alert Email Service
Note: The email service will attempt to check the syntax of the email names. The accepted format is name@service.nnn. This works for the vast majority of email syntaxes but does fail on some unique cases. For example: name@service.museum. If you run into such a syntax conflict, please contact ICONICS.
Starting Services
When you first open the Workbench and then the AlertWorX provider, the traffic light should be green. It means AlertWorX and AlertWorX REST Notification Service are running.
See Also: