Side Panels for Trends
In TrendWorX64 Viewer, you can add charts and pens to tabs so that you can access them in Runtime Mode. You can also add them to a side panel that displays beside the tabs you have created in your display. The side panel appears only if you have enabled the Show Side Panel check box in the Viewer's Appearance tab within the TrendWorX64 Viewer Configurator.
This Side Panel Gives Supplemental Information
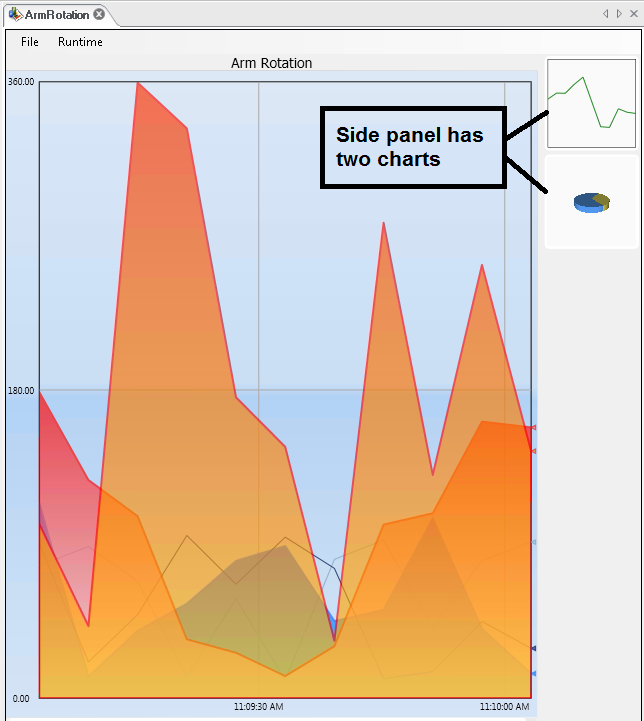
If you wish to show the side panel, you must configure it. Although the side panel has no properties of its own, you can add charts to it and can design those charts in the same way you design them for the viewer's tabs. Keep in mind, however, that the trends that appear in the panel are a miniaturized version of a graph and are therefore best at displaying broad summaries of trends.
|
|
Warning. Not all TrendWorX64 features are supported in Microsoft Silverlight. If you are saving Silverlight files, refer to Silverlight Files in GENESIS64 for more information. |
Adding charts to the side panel in the TrendWorX64 Viewer is similar to adding charts to a tab in the TrendWorX64 Viewer. You do so in the TrendWorX64 Viewer configurator. If you are unfamiliar with the configurator, refer to Working With Trends.
-
To make sure the side panel appears in the viewer, use the Configurator to do the following:
-
-
Select the viewer in the navigation tree.
-
Make sure the Show Side Panel check box is enabled in the viewer's Appearance tab.
-
-
To add a chart to the side panel, use the configurator to do the following:
-
-
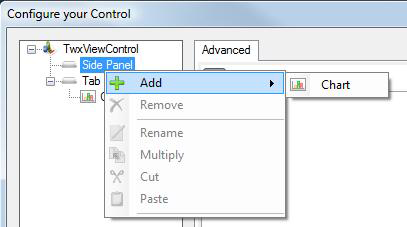
Select Side Panel in the navigation tree.
-
Right-click Side Panel, then hold your cursor over Add and select Chart.
 Click here to see this step.
-
-
To configure a chart for the side panel, follow the guidelines in Chart Options for Trends.
-
To add and configure pens for a chart, follow the guidelines in Pen Options for Trends.