Verifying Your Data with a Tag Report
As you configure your project, you can verify the quality of your project's data sources (tags) by configuring a Dynamics Tags report. The report allows you to filter bad-quality values and inform operators if the sensors are failing, values are out of range, or if issues such as incorrect mapping result in receiving bad-quality samples.
Ideally, good quality values ensure that visualizations and calculations make sense and significantly reduce the load on the system or network due to invalid point names or communication errors.
To configure a tags report:
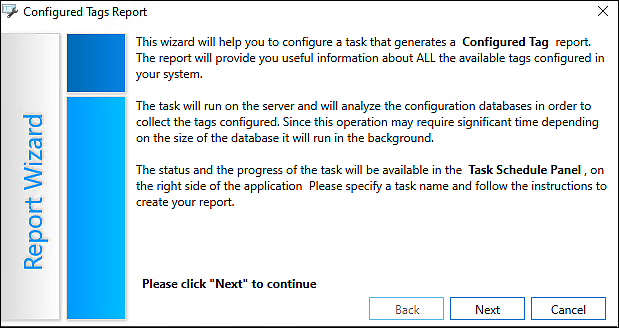
- From the Workbench Project Explorer, right-click your project and select Configured Tags Report to display the Report Wizard.
 View image
 -
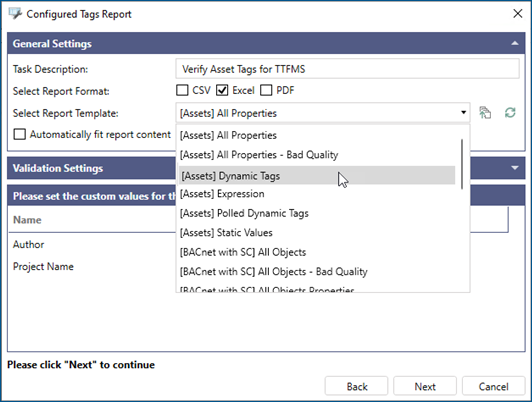
Click Next to display the settings and layout dialog.
View image - Enter the following information:
- (Optional) Task Description— Enter the report description.
- Select Report Format—Select the Excel checkbox.
- Select Report Template—Select [Assets] Dynamic Tags from the list.
- (Optional) Expand the Validation Settings section and select the Validate collected tags checkbox.
-
Click Next. Note that the Assets checkbox is selected, and then click Finish.
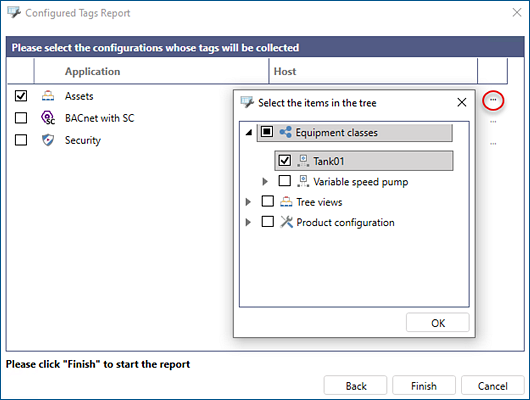 You can click the ellipsis
 to filter specific areas that you want to report on. This filter is useful if you have a large assets configuration.
 - Select the Workbench's Recent Tasks to view the completed report.
-
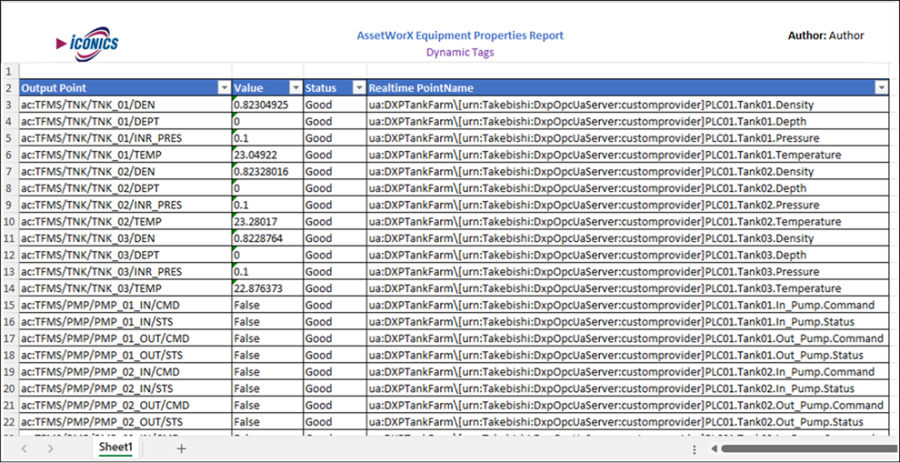
Right-click the completed report and select Download and Open Excel or Download Excel. The following is an example of a completed tag report.
- (Optional) Do the following to filter and sort the report contents using Excel:
- In Excel, select the View tab and in the Workbook Views section, select Normal.
- Click and drag the header cells (Output Point, Value, Status, and Realtime PointName) to expand the data values.
- Select the Data tab and in the Sort & Filter section, select Filter. This allows filtering on the selected report values.
- Save the changes.