Subscribing to Data from a Redundant Cluster
You can visualize any data provided by a redundant cluster by adding the desired data point from the cluster to a GraphWorX display.
To subscribe to data from a redundant cluster in a GraphWorX display:
-
Open GraphWorX in the configuration mode (default) and either open an existing display or work in the canvas to create a new one.
-
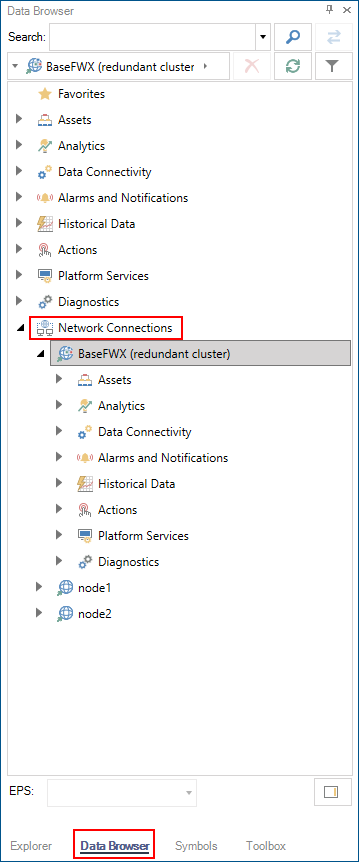
In the left panel of the GraphWorX screen, select the Data Browser tab and expand Network Connections. You can see your redundant FrameWorX cluster, as well as the individual nodes and sub-clusters within it. Expand the cluster and browse to the data point that you want to subscribe.
-
Select the desired data source and drag it onto the canvas. GraphWorX automatically creates the appropriate object or control to visualize the data, and subscribes it to the selected data source. The data source name begins with your cluster name, which tells GraphWorX to request data from the cluster.
-
To visualize real-time data:
When you select a real-time data point, GraphWorX creates a Process Point subscribed to this data. The data source name is displayed in the right panel on the Dynamics tab and begins with
\[YourClusterName]\.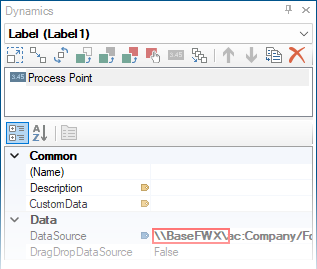
-
To visualize alarms:
-
In the FrameWorX cluster, expand Alarms and Notifications, select Alarm Server, and drag it onto the canvas. GraphWorX creates an Alarm Viewer subscribed to this data.
-
To check the data source name, double-click the Alarm Viewer control to open the configuration dialog.
-
In the left panel, select Grid. The data point subscription for the events is displayed on the Source tab in the Add/Remove Event Points section and uses your cluster name:
\[YourClusterName]\ae:.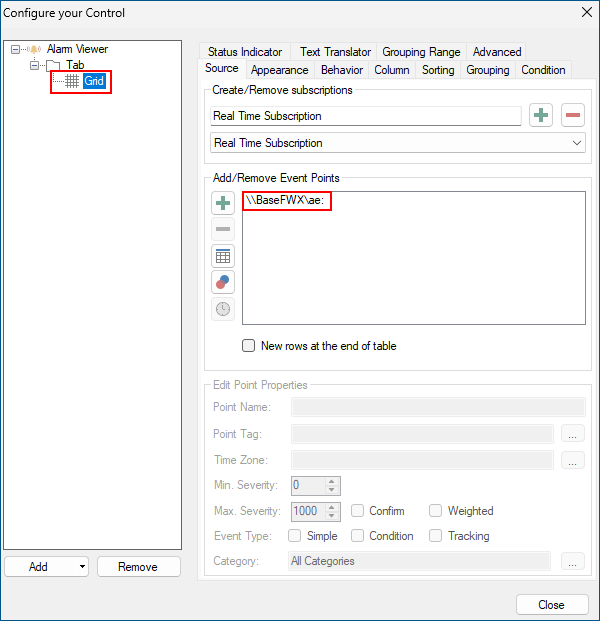
-
-
To visualize historical data:
-
In the FrameWorX cluster, expand Historical Data > Data Historian. Select the desired historical data source and drag it onto the canvas. GraphWorX creates a Trend Viewer subscribed to this data.
-
To check the data source name, double-click the Trend Viewer control to open the configuration dialog.
-
In the left panel, select Pen. The data point subscription that is displayed on the General tab in the Data Source text box uses your cluster name, starting with
\[YourClusterName]\hda:.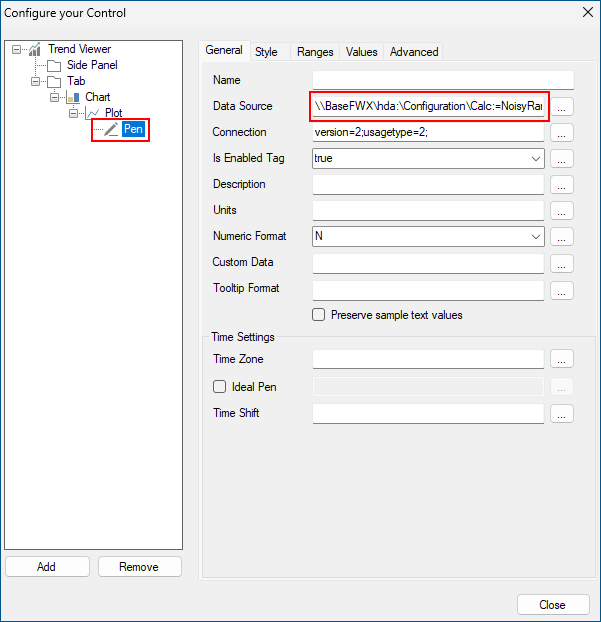
-
-
-
Use the options on the upper right of the GraphWorX screen to switch to the runtime mode
 or to open the display in a web browser
  . The displayed data is provided by the active node in the cluster.