Monitoring the Status of a Redundant Cluster in GraphWorX
You can monitor the status of a redundant cluster in a GraphWorX display by subscribing to the related data points.
The status information of a cluster is available for an OPC UA connection or a FrameWorX connection, including OPC Classic or point manager sub-clusters.
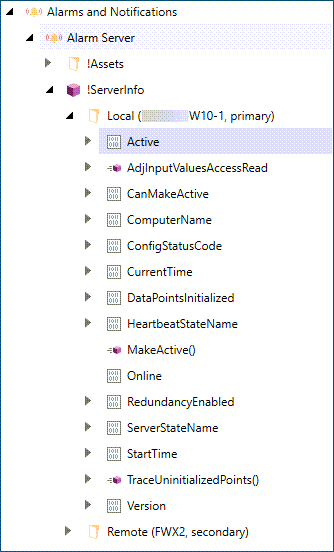
For Alarm Server, Alarm Historian, and Data Historian, you can view the status of each individual server or collector, particularly the Online and Active indicators.
To subscribe to a status data point of a redundant cluster:
-
Open GraphWorX in the configuration mode (default).
-
In the left panel of the GraphWorX screen, select the Data Browser tab and navigate to the status information of the desired cluster. You can find the status points for each connection type in the following locations:
-
FrameWorX, OPC UA, OPC Classic, or point manager redundancy:
Expand Platform Services > Redundancy, then expand the desired redundancy type (FrameWorX/OPC UA/OPC Classic or Point Managers) and the desired cluster.
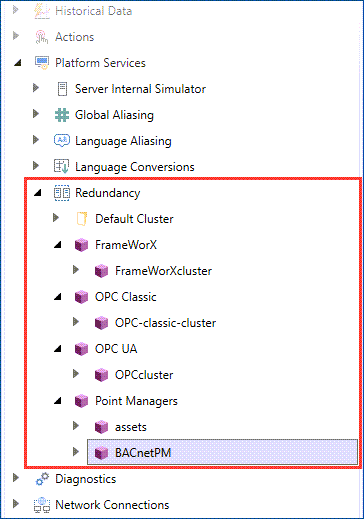
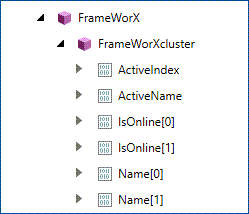
Each cluster contains the same data points.
-
ActiveIndex and ActiveName to identify the currently active connection.
-
Name and IsOnline indicator for each server in the cluster.
-
-
Client redundancy:
Expand Platform Services > Redundancy > Default Cluster and select the Standard point. This is a preconfigured complex point from which clients get the information about the connection. After you perform steps 3 and 4, GraphWorX displays all available status data.
-
Alarm Server:
Expand Alarms and Notifications > Alarm Server > !ServerInfo, and then expand the desired connection.
-
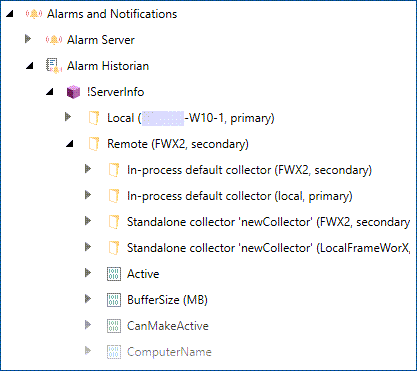
Alarm Historian:
Expand Alarms and Notifications > Alarm Historian > !ServerInfo, and then expand the desired server.
-
Alarm Historian collector:
Expand Alarms and Notifications > Alarm Historian > !ServerInfo, and then expand the primary or secondary server and the desired primary or secondary collector.
-
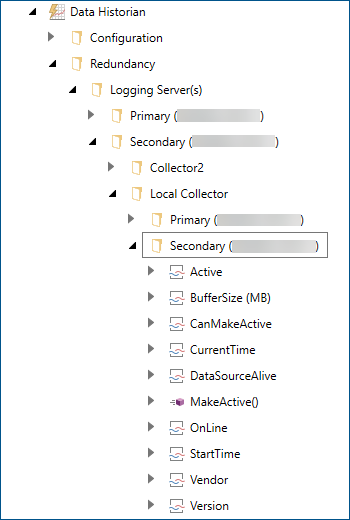
Data Historian:
Expand Historical Data > Data Historian > Redundancy > Logging Server(s), and then expand the desired server.
-
Data Historian collector:
Expand Historical Data > Data Historian > Redundancy > Logging Server(s), and then expand the primary or secondary server, the desired collector, and the primary or secondary connection.
-
-
Select the desired data point and drag and drop it to the canvas.
-
To view the data, use the options on the upper right of the GraphWorX screen to switch to the runtime mode
 or to open the display in a web browser
  .
.