Multi-Client Load in OPC UA Server
The purpose of this test is to assess the GENESIS OPC UA Server's performance under multi-client load. It is assessed for stability, scalability, and its ability to recover system resources after stress.
This test focuses on evaluating the OPC UA Server’s performance under a growing number of simultaneous client connections, ranging from 1 to 100 clients. Each simulated client subscribes to 100 process points to generate realistic communication load. Every load level runs for 10 minutes to observe performance trends over time.
Scenario
-
Server: 4 CPU cores, 24576 MB RAM, Windows 11
-
Client: 4 CPU Cores, 16192 MB RAM, Windows 11
-
Genesis version: 11.02
-
OPC UA client tool used was OPCUA_client_simple
Methodology
Clients were connected sequentially in steps of 1, 5, 10, 25, 50, and 100.
Each load scenario was executed once in a continuous run to ensure consistent conditions.
After each test, the system’s idle state was measured to evaluate resource release and recovery.
Results
|
|
Bytes Received/sec |
Bytes Sent/sec |
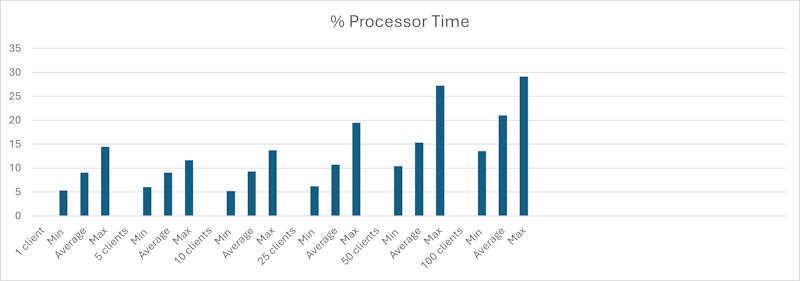
% Processor Time |
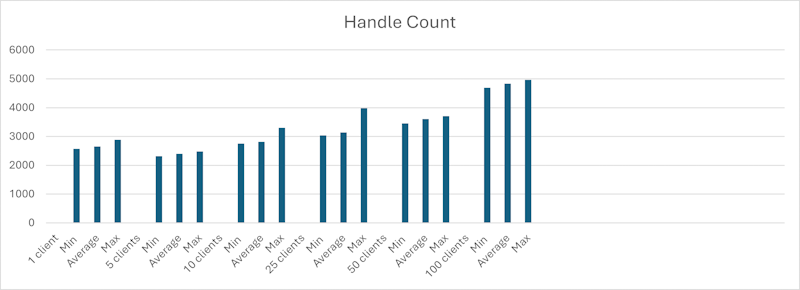
Handle Count |
IO Read Bytes/sec |
IO Write Bytes/sec |
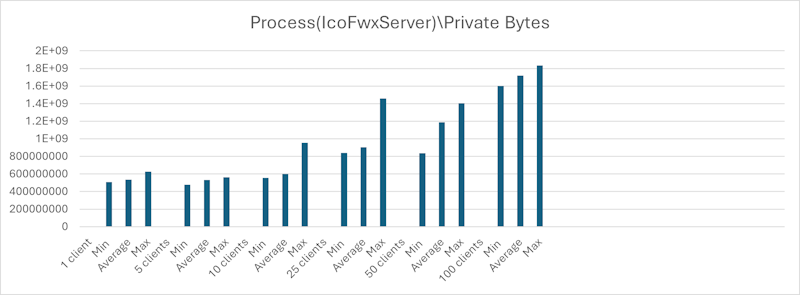
Process(IcoFwxServer)\Private Bytes |
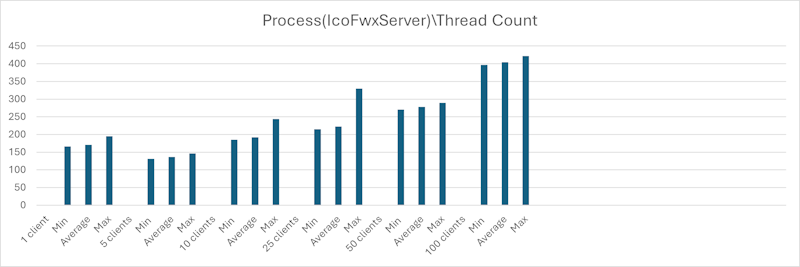
Process(IcoFwxServer)\Thread Count |
Process(IcoFwxServer)\Virtual Bytes |
Process(IcoFwxServer)\Working Set |
Process(IcoFwxServer)\Working Set Peak |
|---|---|---|---|---|---|---|---|---|---|---|---|
|
1 client |
|||||||||||
|
Average |
7909.16 |
23214.96 |
9.07 |
2646 |
5449.65 |
5812.19 |
535427473 |
171 |
2481410000000 |
533611307 |
1049165824 |
|
Min |
6214.64 |
21236.07 |
5.31 |
2569 |
5014.54 |
5370.39 |
509685760 |
166 |
2481400000000 |
406331392 |
1049165824 |
|
Max |
812844.46 |
546311.56 |
14.48 |
2885 |
5861.95 |
6259.80 |
625283072 |
195 |
2481450000000 |
582283264 |
1049165824 |
|
5 clients |
|||||||||||
|
Average |
17047.30 |
26782.76 |
9.10 |
2400 |
5386.09 |
5746.52 |
530197654 |
137 |
2481350000000 |
514679060 |
977412096 |
|
Min |
6855.29 |
25319.53 |
6.05 |
2316 |
4968.87 |
5278.67 |
476442624 |
131 |
2481340000000 |
396099584 |
977412096 |
|
Max |
827030.55 |
41232.95 |
11.68 |
2477 |
5686.05 |
6224.05 |
563744768 |
146 |
2481370000000 |
545726464 |
977412096 |
|
10 clients |
|||||||||||
|
Average |
18685.32 |
23817.18 |
9.29 |
2816 |
5414.21 |
5776.09 |
599470139 |
192 |
2481450000000 |
541433185 |
1049165824 |
|
Min |
6796.11 |
21212.88 |
5.21 |
2747 |
4919.09 |
5288.61 |
555257856 |
185 |
2481430000000 |
425873408 |
1049165824 |
|
Max |
8266838.27 |
167799.37 |
13.74 |
3305 |
5830.70 |
6408.63 |
955305984 |
244 |
2481530000000 |
799711232 |
1049165824 |
|
25 clients |
|||||||||||
|
Average |
8793.13 |
23848.83 |
10.73 |
3139 |
5438.83 |
5806.55 |
903034077 |
222 |
2481490000000 |
659928236 |
1049165824 |
|
Min |
7552.85 |
21807.63 |
6.25 |
3041 |
5118.93 |
5412.31 |
840413184 |
215 |
2481480000000 |
450895872 |
1049165824 |
|
Max |
39452.96 |
203563.47 |
19.50 |
3981 |
5813.25 |
8160.30 |
1458622464 |
330 |
2481660000000 |
978485248 |
1049165824 |
|
50 clients |
|||||||||||
|
Average |
18646.05 |
28100.82 |
15.37 |
3607 |
5336.93 |
5711.62 |
1188058293 |
278 |
2480000000000 |
631777160 |
1048917333 |
|
Min |
10393.32 |
25123.36 |
10.41 |
3457 |
4842.13 |
5149.60 |
835997696 |
270 |
2480000000000 |
398053376 |
1019076608 |
|
Max |
828172.65 |
65256.96 |
27.26 |
3704 |
5725.82 |
8360.05 |
1404694528 |
289 |
2480000000000 |
1048838144 |
1049165824 |
|
100 clients |
|||||||||||
|
Average |
20596.67 |
11534.24 |
21.01 |
4833 |
5413.27 |
5774.88 |
1717636044 |
405 |
2481780000000 |
675019533 |
980983808 |
|
Min |
16260.76 |
9496.03 |
13.55 |
4693 |
4964.58 |
5298.34 |
1601839104 |
397 |
2481770000000 |
369238016 |
980983808 |
|
Max |
7561717.39 |
1018450.47 |
29.13 |
4960 |
5834.91 |
6223.27 |
1833033728 |
422 |
2481810000000 |
927338496 |
980983808 |
Summary
-
Data updates remained stable across all load levels from 1 to 100 clients.
-
CPU and memory usage increased proportionally with the number of connected clients.
-
System performance showed no noticeable degradation even at maximum load.
-
All sessions stayed active without timeouts, disconnects, or data loss.
-
Logs showed no unhandled exceptions during the test.
-
After client disconnection, resources were released properly — no leaks or zombie sessions were observed, and system usage returned close to the idle baseline.