Using Health Monitor to Expose Performance Counters
Health Monitor is a GENESIS feature that is designed to provide system health and performance information. It collects and organizes data from GENESIS point managers. Each point manager exposes a list of performance counters that are set by default, depending on the specific data it is tracking.
Performance counters are internal variables that can be set up to generate alarms and log warnings in Windows Event Log. The counters may be of a single instance or of multiple instances. A multi-instance counter means the counter exists for multiple objects of the same kind.
After the Health Monitor collects and organizes the data, you can visualize it in various ways, using the following tools:
GraphWorX
By default, performance counters are exposed as data points in the Data Browser, and you can visualize them in GraphWorX displays.
Before you create your own display, you can explore the predefined graphic system health monitoring interface. It opens as a set of GraphWorX displays that visualize the available data points. You can access the interface in two ways:
-
In GraphWorX, switch to runtime and select System Monitor on the top ribbon.
-
In the Windows search box, enter Health Monitor.
To visualize performance counters in a GraphWorX display:
-
Open GraphWorX and go to the Data Browser in the left panel.
-
Expand Diagnostics > Control and Diagnostics > Metric. The Metric folder contains the performance counters.
-
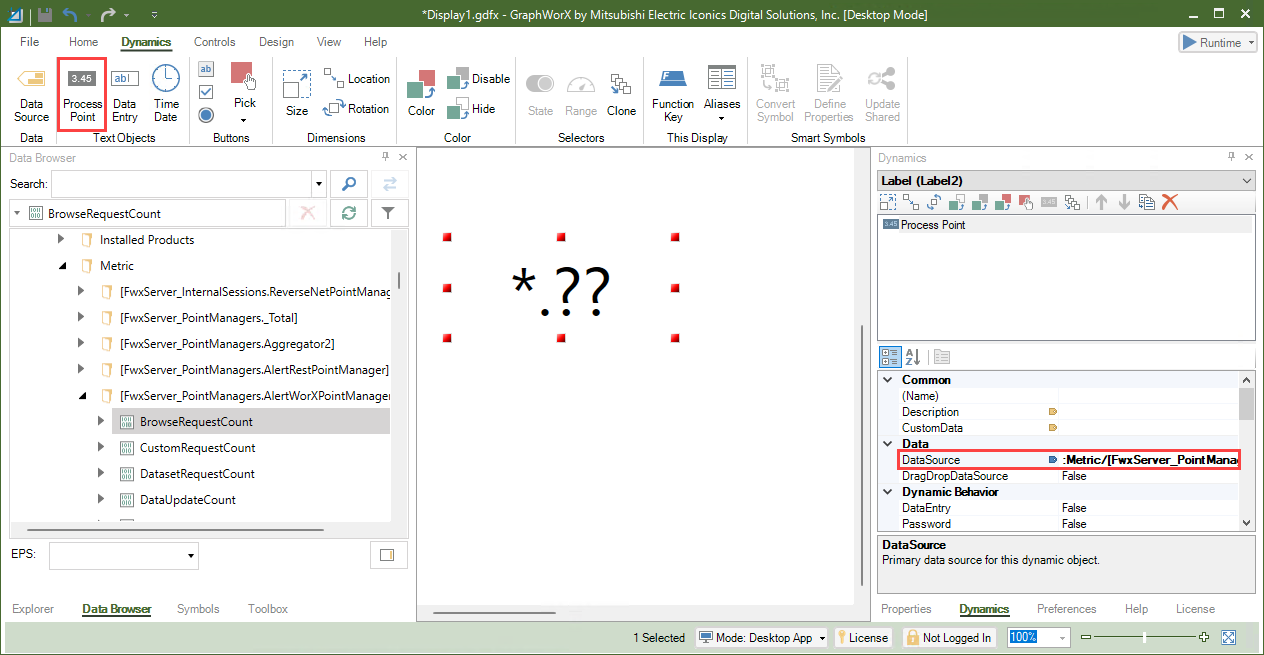
On the Dynamics tab, select Process Point, click in the canvas, and drag diagonally to insert the process point box. In the Data Browser, select the desired counter and drag and drop it into the process point. The selected data point is added into the DataSource field in the right panel.
-
View the current value of the counter in runtime. Use the options on the upper right of the GraphWorX screen to switch to the runtime mode
 or to open the display in a web browser
  .
.
Windows Performance Monitor
Performance counters, except the Session and SessionByPID categories, are exposed as Windows Performance Counters (not available in Azure) and can be viewed and logged with Windows Performance Monitor (perfmon.exe).
Session and SessionByPID are not exposed as Windows Performance Counters by default because their number grows over time, and the total number of created Windows Performance Counters is limited. If needed, you can temporarily enable them for troubleshooting by changing the <EnableCountersPerClient> and <EnableCountersPerClientSession> items in FwxServer.config.json, which can be found in C:\ProgramData\ICONICS\11\Servers.
Dotnet-counters
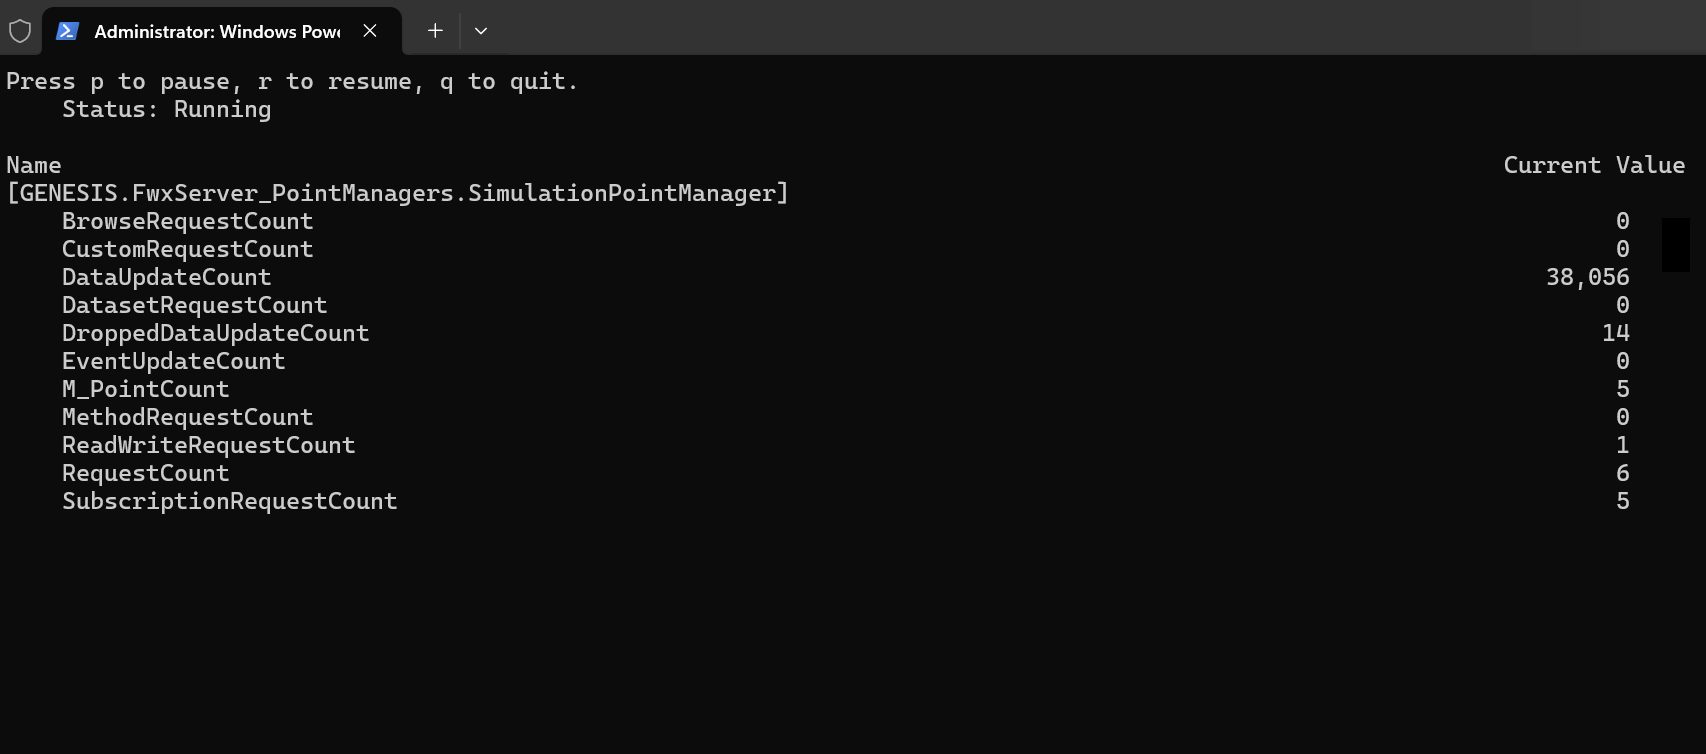
You can use the dotnet-counters utility to monitor point manager counters in Linux. The functionality of the dotnet-counters utility is equivalent to the performance counters, but uses cross-platform technology.
Follow the documentation on dotnet-counters (including the download link) on Microsoft Learn.
To use Health Monitor data in dotnet-counters, run:
Example:
OpenTelemetry
OpenTelemetry is a cross-platform, open standard observability tool used for collecting and displaying telemetry data. It can be used with a variety of backends.
To get the OpenTelemetry (OTLP) metrics, you need an OTLP collector and a separate tool that displays the collected data. The following procedure describes visualizing performance counters in Grafana using Prometheus as the OTLP collector. It sends batches with up to 1024 messages up to every 15 seconds (it might be faster if the queue is full). Learn more about using Prometheus as your OpenTelemetry backend.
To connect to Prometheus in Grafana:
-
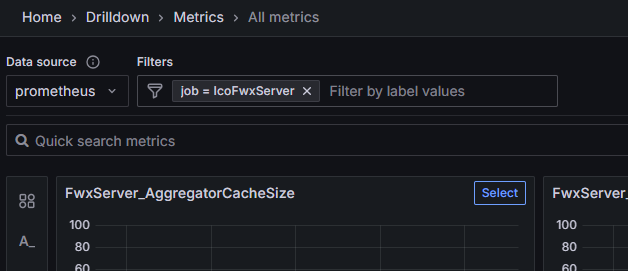
Open Grafana and select Drilldown > Metrics.
-
In Data Source, select Prometheus.
-
In Filter, enter job = IcoFwxServer (or any other process you want to monitor).
-
Set the environment variable,
ICO_METRIC_COLLECTOR, to the OTLP collector endpoint (http://localhost:9090/api/v1/otlp/v1/metrics) to activate the OTLP metric export.The Prometheus OLTP collector endpoint URI is different from standard OTLP collectors. The standard default URI (http://localhost:4318/v1/metrics) is typically used with a different OTLP collector than Prometheus.
-
(Optional) Set up additional parameters:
-
Enable gzip compression using the suffix
#gzip. For example:http://localhost:9090/api/v1/otlp/v1/metrics#gzipOn local networks where bandwidth is not a problem, gzip is not recommended because it is slower.
-
Enable basic authentication using the suffix
#user=<username>&pass=<password>. For example:http://localhost:9090/api/v1/otlp/v1/metrics#user=admin&pass=pass -
Enable writing extra debug information into stdout (console) for troubleshooting using the suffix
#debug. For example:http://localhost:9090/api/v1/otlp/v1/metrics#user=admin&pass=pass&debug
-