Available Plot Types in Trend Viewer
In the Trend Viewer control in GraphWorX, you can create various types of charts. To select the desired type, open the Trend Viewer configuration by double-clicking anywhere in the control and in the left panel of the configuration dialog, select Plot. In the right panel on the Plot tab, select the desired plot in the Available Plot Types section.
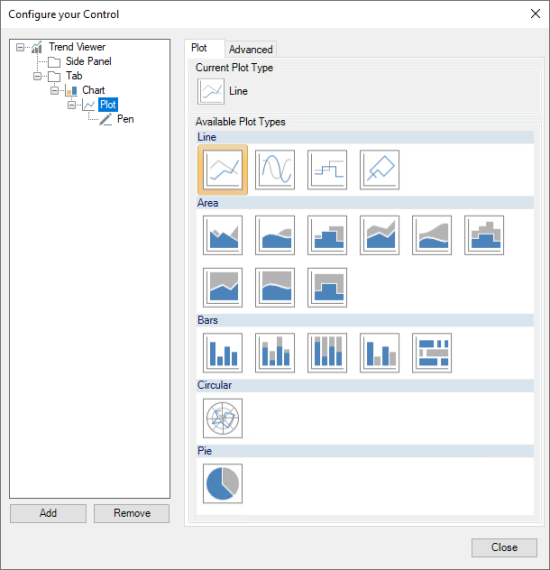
The following table lists the available plot types and their descriptions.
|
Example Image |
Plot Type Name |
Description |
|---|---|---|
|
|
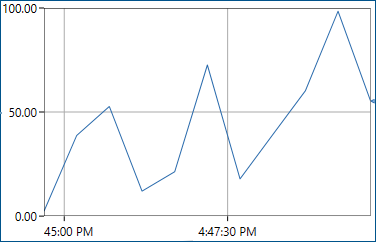
Line |
Draws samples from a pen (the data source) as a line. The sample's values are plotted against time stamps. |
|
|
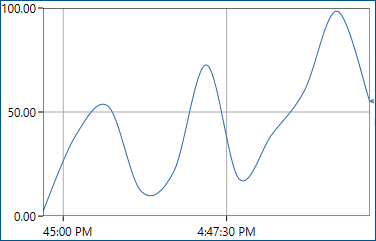
Spline |
Draws samples from a pen (the data source) as a spline. The sample's values are plotted against time stamps. |
|
|
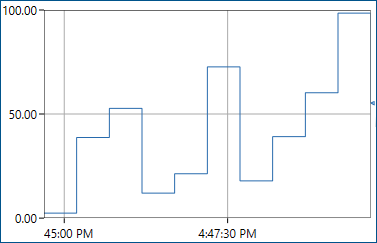
Stepped Line |
Draws samples from a pen (the data source) as a stepped line. The sample's values are plotted against time stamps. |
|
|
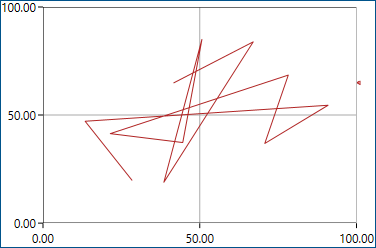
XY |
The plot combines samples from two pens (data sources) into a single line. The resulting samples of the current time window are plotted against the X and Y axis. |
|
|
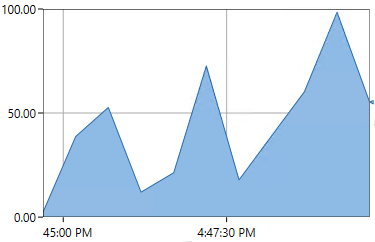
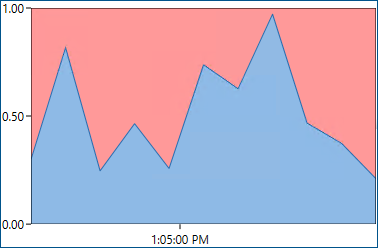
Area |
Draws samples from a pen (the data source) as an area. The sample's values are plotted against time stamps. |
|
|
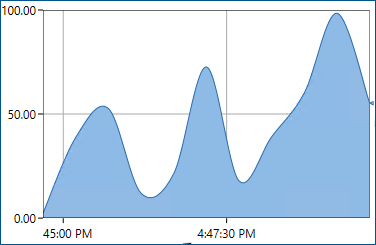
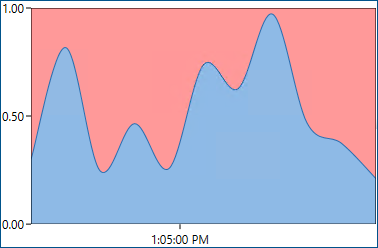
Spline Area |
Draws samples from a pen (the data source) as a spline area. The sample's values are plotted against time stamps. |
|
|
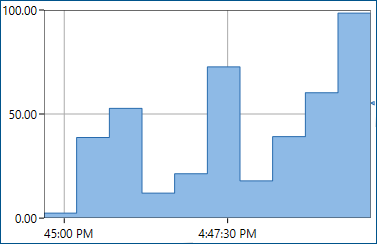
Stepped Area |
Draws samples from a pen (the data source) as a stepped area. The sample's values are plotted against time stamps. |
|
|
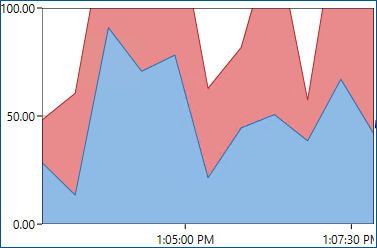
Stacked Area |
Draws samples from pens as areas stacked on each other. The sample's values are plotted against time stamps. |
|
|
Stacked Spline Area |
Draws samples from pens as spline areas stacked on each other. The sample's values are plotted against time stamps. |
|
|
Stacked Stepped Area |
Draws samples from pens as stepped areas stacked on each other. The sample's values are plotted against time stamps. |
|
|
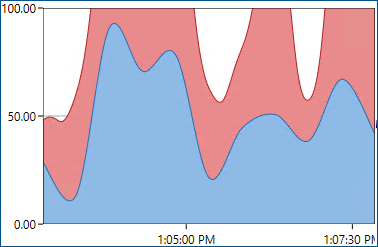
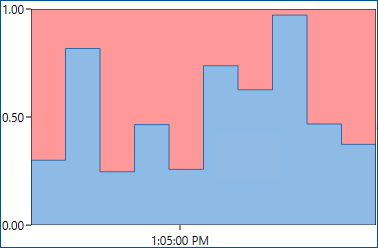
100 % Stacked Area |
Draws samples from pens as areas stacked on each other and normalizes them to fill the entire space. The sample's values are plotted against time stamps. |
|
|
100 % Stacked Spline Area |
Draws samples from pens as spline areas stacked on each other and normalizes them to fill the entire space. The sample's values are plotted against time stamps. |
|
|
100 % Stacked Stepped Area |
Draws samples from pens as stepped areas stacked on each other and normalizes them to fill the entire space. The sample's values are plotted against time stamps. |
|
|
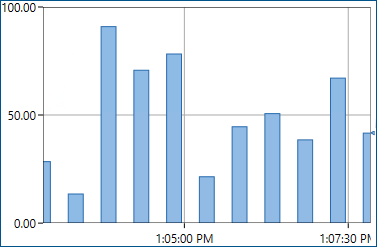
Bars |
Draws samples from a pen (the data source) as parallel bars. The height of each bar represents a sample's value. |
|
|
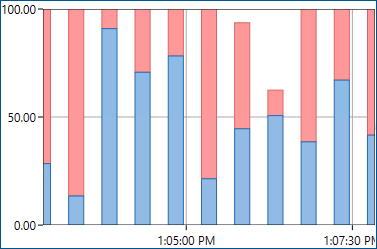
Stacked Bars |
Draws samples from pens as bars stacked on each other. The sample's values are plotted against time stamps. |
|
|
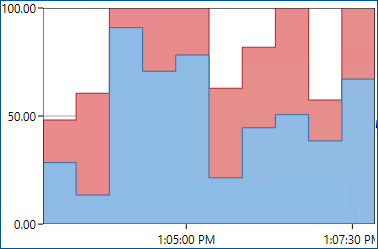
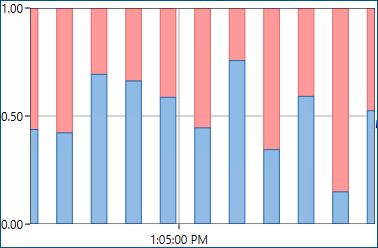
100 % Stacked Bars |
Draws samples from pens as areas stacked on each other and normalizes them to fill the entire space. The sample's values are plotted against time stamps. |
|
|
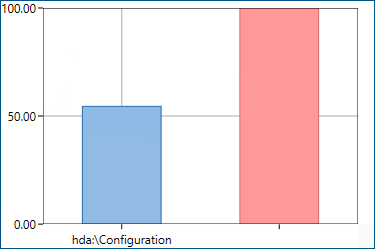
Histogram Only available in the desktop application
|
Draws samples from multiple pens (data sources) as parallel bars. The height of each bar represents a pen's value for the current instant. |
|
Event Bar |
Draws samples from a pen (the data source) as horizontal bars. Each sample is a new bar. The bar height is one unit of the attached axis. |
|
|
|
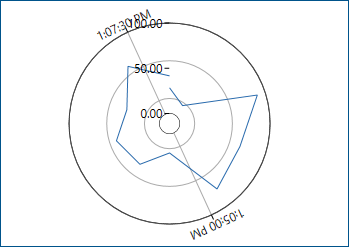
Circular Only available in the desktop application
|
Draws samples from a pen (the data source) as a line in a circular chart. The sample's values are plotted against time stamps. |
|
|
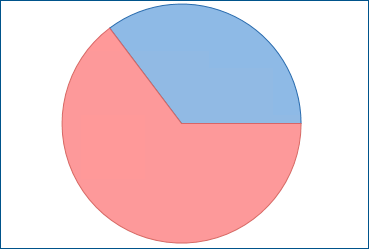
Pie Only available in the desktop application
|
Draws samples from multiple pens (data sources) as slices of a pie. The size of each slice represents a pen's value for the current instant. |