Adding Trend Viewer to a GraphWorX Display
Adding a Trend Viewer control to a GraphWorX display allows you to build a dynamic, data-driven visualization tailored to your operational needs.
To add a Trend Viewer control and select the data source:
- Open GraphWorX in the configuration mode (default). You can add Trend Viewer to an existing display or create a new one.
- On the Controls ribbon, select Trend Viewer, and then drag the mouse diagonally across the canvas to make a rectangle for inserting the viewer.
- Double-click anywhere inside the control to open the configuration dialog and in the left panel, select Pen.
-
On the General tab on the right, click
 next to the Data Source text box.
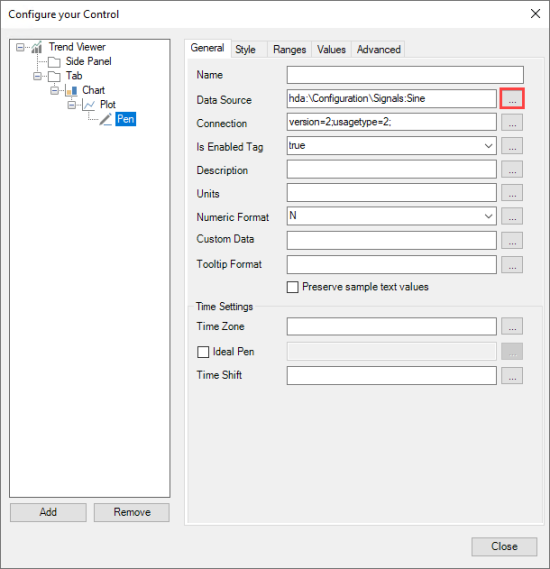
- In the Data Browser dialog that opens, select the desired data point, and then click OK to close Data Browser.
-
(Optional) Add more data sources.
- At the bottom of the left panel, click Add to create a new pen.
- Select the new pen to display its settings on the right and repeat steps 4 and 5 to connect the pen with the desired data source.
- When finished, click Close. Use the options on the upper right of the GraphWorX screen to switch to the runtime mode
 or to open the display in a web browser
  . The Trend Viewer chart will display the selected data using the default visual settings.