Adding a Map Control Display
You can use Map Control in GraphWorX to create and configure an interactive map in a GraphWorX display. To create an interactive map, you create a new display in GraphWorX and insert a Map Control viewer from the Controls ribbon.
You can zoom in and out of the map and place interactive GraphWorX objects on it. Every object that you add to the display has a latitude and longitude on the map. You can connect dynamic tags to the longitude and latitude properties, and you can use GPS for Dynamics in Map Control.
Since some features are unique to Map Control, plan the assembly of your map to be constructed in accordance with the Map Control features and limitations.
You can only add a map to the primary (or root) layer of a display. Once Map Control is added to a GraphWorX display, the map becomes the primary focus; other GraphWorX objects cannot be added behind or on the periphery of the map. Any objects added to the map, such as shapes or pins, are added to the primary layer and interconnected with the map.
By default, the shapes and controls are assigned a latitude and longitude in relation to the map, allowing them to become part of the map's surface, even if they are in a separate layer. However, you can add extra layers containing shapes and controls, and specify their settings related to NoZoom, NoPan, and NoScaling to create an independent layer that behaves distinctly from the map and zoom attributes in runtime. You can use this for custom overlay information that locks to a certain position, such as a legend or toolbar.
For these reasons, we suggest using a dedicated GraphWorX display for the Map Control, and then embed this display into your larger user interface design as an embedded viewer.
You can select from multiple supported map types. The default map system with preconfigured data is Esri maps.
Esri replaces Bing, the previous default map type in GENESIS versions 10 and earlier, since Bing map support has been retired. Your previously configured displays that are using demo Bing tiles are automatically converted to Esri basemaps with the Streets layer. Previously configured displays that are using licensed Bing tiles are not converted; they are kept in their current state.
To create a new GraphWorX display with Map Control:
-
Open GraphWorX in the configuration mode (default). On the Controls ribbon, select Map Control, and then drag the mouse diagonally across the canvas to make a rectangle for inserting the viewer.
-
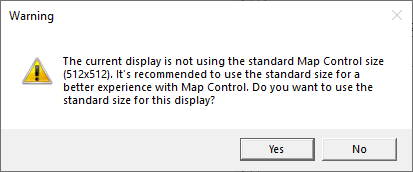
A warning message appears, informing you that the display is not using the standard Map Control size, and asking if you want to display the standard size.
Do one of the following:
-
Click Yes to create a standard-size map (recommended). The display size will be adjusted to perform optimally with the tiled map layers. This formatting ensures good performance when zooming the map in or out in runtime while allowing map tiles and objects to scale correctly.
-
Click No to create a space around the edge of the map where you can add objects that are independent on the map. Keep in mind that objects added outside the map become very large and unusable when you zoom in on the map, so we do not recommend this option. However, you can use it to add an object such as a trend or alarm viewer on a map that you do not zoom in on.
-
-
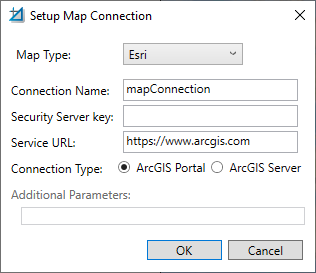
On the Map Control Configuration ribbon, expand Setup Connection and select Add New Connection to open the Setup Map Connection dialog.
-
In Map Type, select Esri, which is the default map system with preconfigured data, and then click OK. If you select any other available map type, you need to configure the required settings.
You can add multiple connections to your Map Control.
-
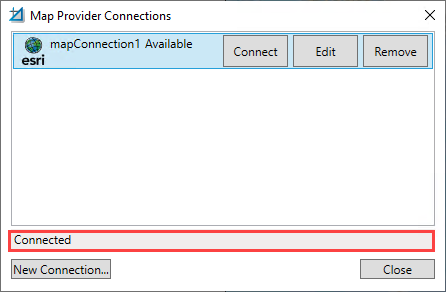
When finished, expand Setup Connection again and select Manage Connections to display the Map Provider Connections dialog. It displays the list of configured connections with the Available/Unavailable status and buttons for connecting, editing, or removing the connection. You can also add a new connection from here.
-
Select the desired connection and click Connect. When the gray field below the list returns "Connected", click Close.
-
On the Map Control Configuration ribbon in the Map information section, enter the zoom level by selecting a number from 1 to 16 in the Zoom Level drop-down list. In the Latitude and Logitude fields, enter the latitude and longitude of the center of the display, or use the display scroll bars to adjust the map to the desired area, and the values are entered automatically.
-
On the Map Control Configuration ribbon in the Navigation section, select Default Region when you wish to set the default starting region. This option will reset the frame of the display to just the currently viewed area, resetting the zoom level of the GraphWorX display to 100%.
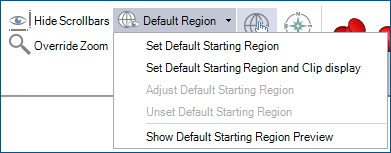
Setting a starting region can be useful, as it helps frame the Map Control and avoid users from getting lost or navigating to the wrong part of the map during runtime. It also can help improve accuracy of placed objects, as Latitude and Longitude placement of elements can become less precise at very high zoom levels.
-
Verify the Map Control settings in runtime. Use the options on the upper right of the GraphWorX screen to switch to the runtime mode
 or to open the display in a web browser
  .
.