Adding a Trending Display
You can use the Trend Viewer to create, configure, and plot real-time or historical data trends from various sources, such as alarms and historical data, through OPC UA and other data point connections through the FrameWorX server.
To add the temperature trending display:
- Open GraphWorX (use the Windows search box to locate and open the app).
-
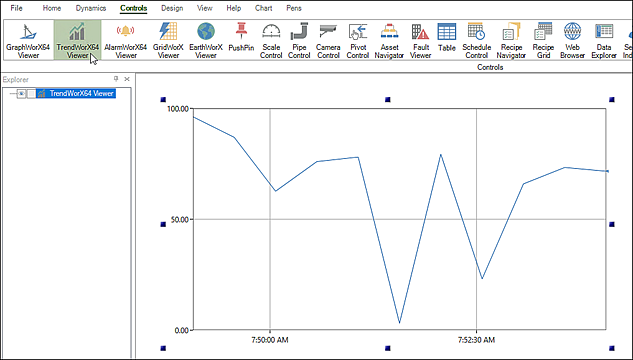
On the Controls ribbon, click Trend Viewer, and then click in the canvas and drag a rectangle to add and size the trend chart.
-
Double-click the chart to display the Configure your Control dialog.
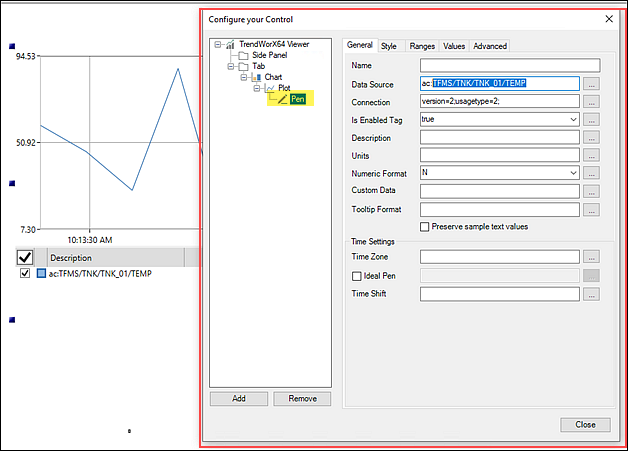
- Select Pen to open the General tab. Do the following:
- Click
 next to the Data Source text box to open Data Browser.
 - From the Data Points tab, expand Assets > Tank Farm Management System > Tanks > Tank 01.The Data Source prefix ac: is used to point to Assets.
- Select Temperature (°C) and click OK to close the Data Browser.
- Click
- On the Ranges tab, select Auto Scale for both the Minimum and Maximum range, and then click Close.
-
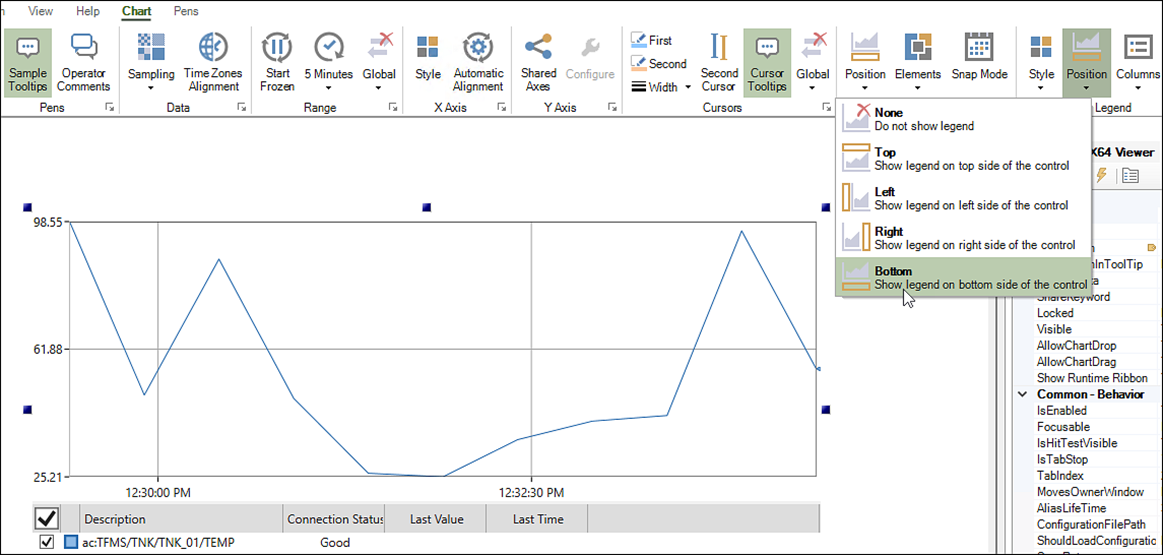
On the Chart ribbon, go to the Legend section and select Position > Bottom. This displays descriptive information about the tank temperature.
-
To view the Tank 01 Temperature in real time, click Runtime in the upper right corner, and then do the following:
-
Click the Real-time Cursors button. This places a blue horizontal line in the chart. You can move the line with the mouse to see various temperature values over time.
You can adjust the default trend period (every 5 minutes) to suit your needs.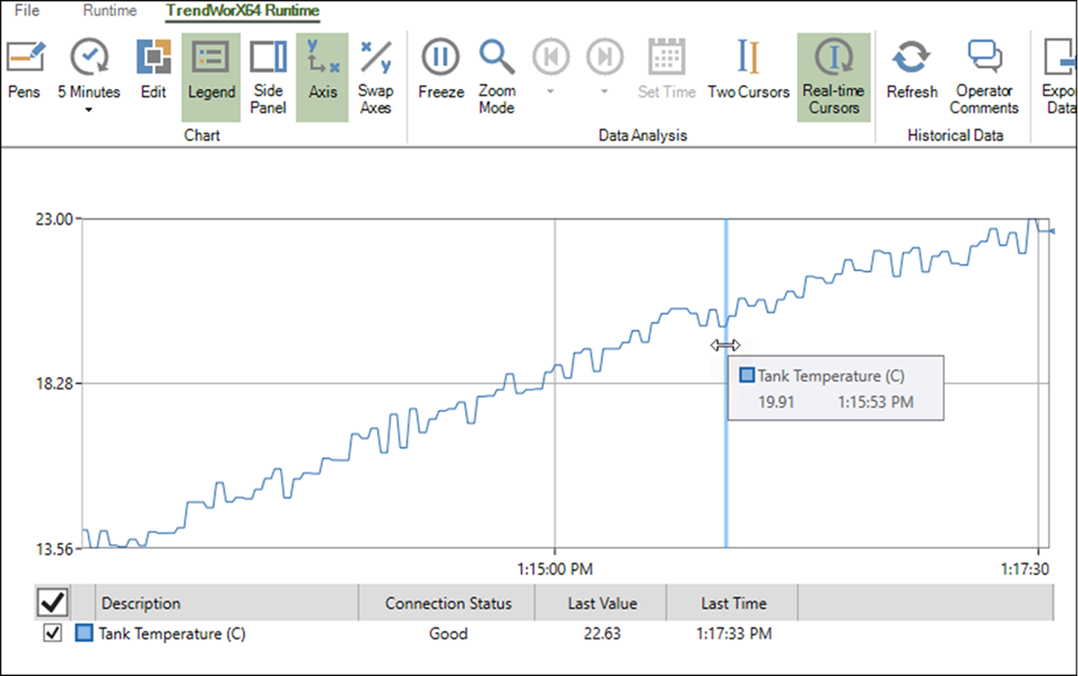
- When finished, click Configure in the upper right corner to return to the configuration mode.
- In the toolbar, click File > Save As and name the file. By default, the file is saved to C:\ProgramData\ICONICS\PubDisplay.
-