TraceWorX Log Viewer Settings
TraceWorX Log Viewer is an application that reads TraceWorX log files and presents them in a human-readable format.
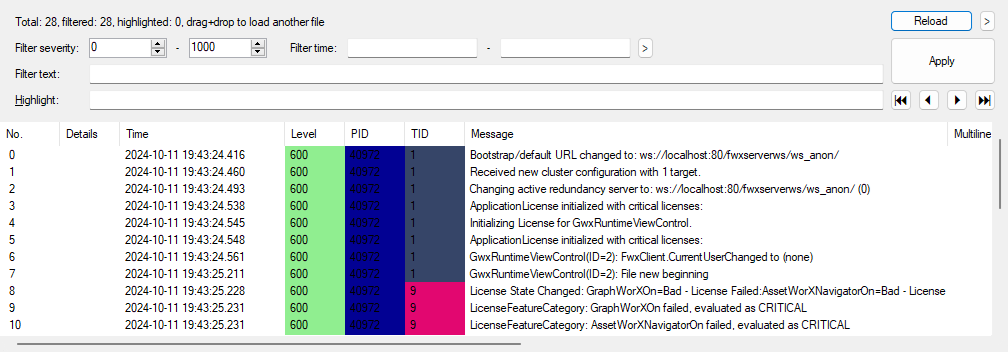
The TraceWorX Log Viewer includes the following information.
| Column | Description |
|---|---|
| No. | Sequence number of the trace message. This defines the order in which trace messages occur. |
| Details |
Link to a dialog containing extra information associated with the message, such as a call stack, if such details are available. |
| Time | The time and date when this trace event occurred. |
| Level |
The numeric trace level associated with the message. This indicates the type of the trace message, such as an error, a warning, or a debug message. Learn more The column is color-coded, so you can easily distinguish important message types, such as errors. |
| PID | Numeric identifier of the process (PID) of the application/service instance that generated this trace message. For example, if you are running two instances of GraphWorX, you will see messages with two different PIDs in the GraphWorX trace log. The column is color-coded, so you can easily distinguish which messages came from a particular application instance. |
| TID | Numeric identifier of the thread that generated this trace message. An application may have multiple threads running simultaneously. The column is color-coded, so you can easily distinguish which messages came from a particular thread. |
| Message | The text description of the event. This helps you understand what was happening at that moment in the execution of the application. |
| Multiline | The text message for a trace event is usually a single line of text. Occasionally a trace message may be multiple lines of text. In this case, a "multiline" link will be provided to popup a window containing all the lines of the text message. |
| Source file name | This will normally say "Unknown". This is only used for our internal development and analysis. |
| Source file row | This will normally be zero. This is only used for our internal development and analysis. |
| Source file column | This will normally be zero. This is only used for our internal development and analysis. |
| Assembly name | The full .NET identification of the DLL in which the event occurred. |
| Assembly code base | The full file path of the DLL in which the event occurred. |
| Namespace | The organizational container for the class in which the application code was executing when the event occurred. |
| Thread name | The text moniker of the thread that generated this trace message. This is often empty, but may sometimes be a name that indicates the kind of work that the thread performs. |
| Class name | The organizational container for the function in which application code was executing when the event occurred. |
| Method info | The function name (and parameters) in which the application code was executing when the event occurred. |
Filtering Messages in TraceWorX Log Viewer
Since a TraceWorX log can contain large numbers of trace messages, it can be useful to filter out certain messages when analyzing logs. Filtering allows you to hide messages that are not relevant to the issue that you are diagnosing.
Filtering options include:
|
Option |
Description |
|---|---|
|
Filter severity |
Specifies the range of trace levels for messages to be displayed. All trace messages outside of the specified range are hidden. |
|
Filter time |
Specifies a time range for the messages to be displayed. All trace messages outside of the specified time range are hidden. |
|
Filter text |
Displays only messages that include the specified text. |
Highlighting Messages in TraceWorX Log Viewer
When analyzing trace log files, it may be desirable to quickly find certain messages within the log. Highlighting allows you to visually mark messages that you want to easily identify in the overall sequence of events.
Rows that include the specified highlighted text are colored gray in the user interface, and you can use the arrow buttons to quickly navigate through the highlighted rows.