Displaying Web Services Data Using Process Points
You can use process points in GraphWorX to access individual properties of a web methods's result. It offers a quick and convenient way to display scalar values and enables using Web Services data with clone dynamics.
To display Web Services data using process points:
- Open GraphWorX in the configuration mode (default).
-
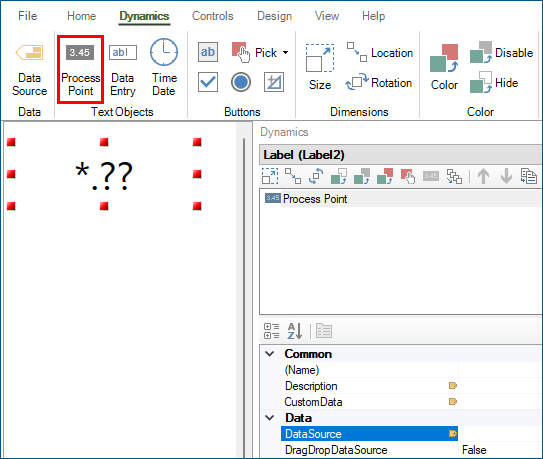
On the Dynamics ribbon, select Process Point, and then drag the mouse diagonally across the canvas to make a rectangle for inserting the process point. The process point is added to the screen and in the Dynamics pane on the right, a property grid is displayed with the Data Source box pre-selected.
-
In Data Source, click
 to open Data Browser.
 -
Go to Data Connectivity > Web Services, expand the desired folder and web method (National Weather Service > Forecast), expand the web method's return schema (0), select the desired property (temperature), and then click OK.
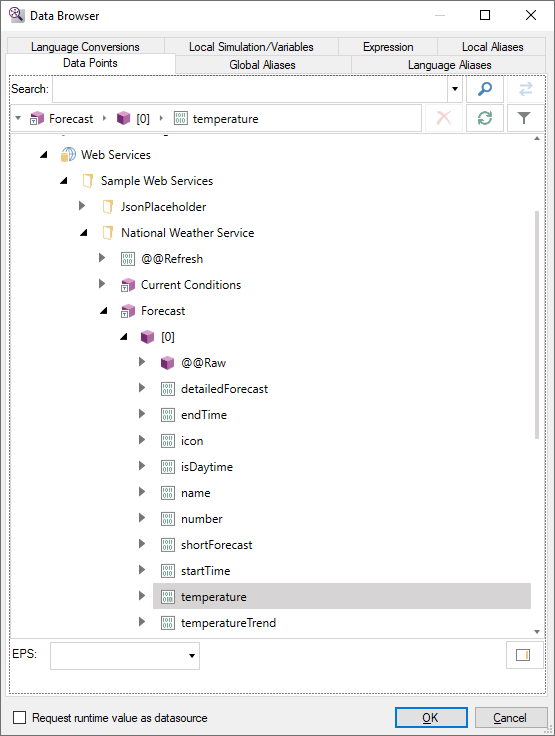
The tag name in the Data Source box references the item at index [0] (first item) in the array returned from the REST API. To visualize the data for a different item in the array, enter the index of the item between the square brackets.
ws:Sample Web Services.National Weather Service.Forecast<@gridX=72, @gridY=76, @grid='BOX'>[0].temperature -
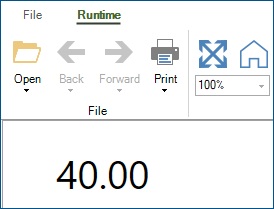
In the upper right corner of the GraphWorX screen, click
 , or press CTRL+M. GraphWorX switches to the runtime mode and the data from the selected property is displayed in the process point.