Displaying Web Services Data in Grid Viewer
Web methods are exposed by the GENESIS Web Services point manager as data sets. Data sets are tabular structures that can be directly consumed by several GraphWorX controls, including Grid Viewer, Table, and Data Diagram.
To display Web Services data in the Grid Viewer:
- Open GraphWorX in the configuration mode (default).
- On the Controls ribbon, select Grid Viewer, and then drag the mouse diagonally across the canvas to make a rectangle for inserting the Grid Viewer control.
-
Double-click anywhere in the viewer to open the configuration settings.
Alternatively, you can click Configure on the Grid Configuration ribbon. - In the left pane of the Configure your control dialog, select Grid.
-
In the right pane on the Source tab, click
 in the Create/Remove Subscription section and select Data Set Tag Subscription. A Data Browser dialog opens.
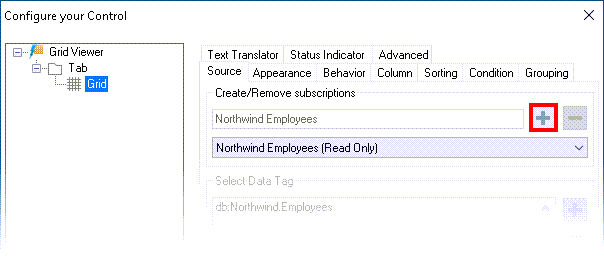
-
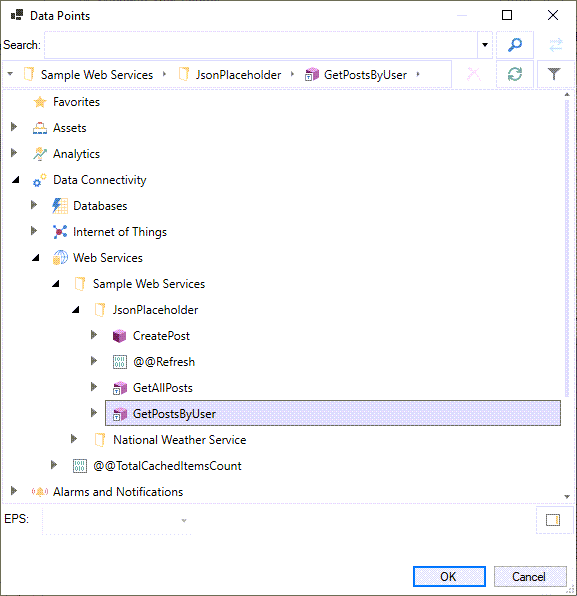
Go to Data Connectivity > Web Services, expand the folder containing the desired service JsonPlaceholder, select the desired web method GetPostsByUser, and then click OK.
-
When the tag for the selected web method, including parameters, appears in the Select Data Tag box and the web method columns and data types appear in the Data Tag Fields retrieved area, click Close.
You can manually modify the value of the parameters in the Select Data Tag field.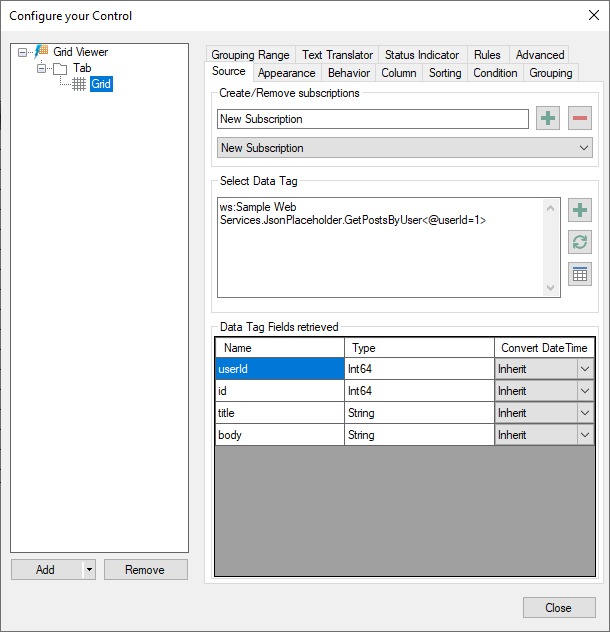
-
In the upper right corner of the GraphWorX screen, click
 , or press CTRL+M. GraphWorX switches to the runtime mode and data from the REST API populates the Grid Viewer via the configured web method.