Simulating Historical Data
The Simulator can provide simulated historical data. Use the same syntax as real-time simulated tags. Only raw data is supported, not aggregated data.
View historical simulated data in a trend viewer:
-
Add a pen to a trend viewer.
-
Use any numerical real-time simulator tag for the data source. For example: svrsim:sine float -100 100
-
Configure the connection to use HDA connection with a filter of raw data.
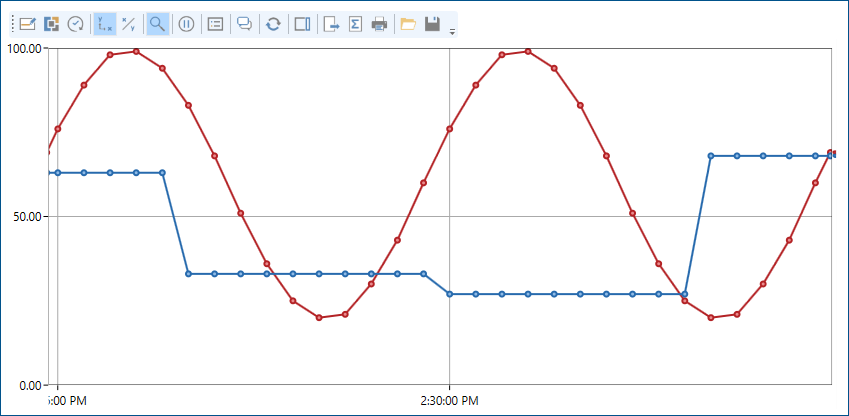
The historical sampling rate for these tags is 1 minute. Use longer periods (30 minutes or more) to get the best looking graphs.
Here is an example of simulated raw historical data in a trend viewer: