Creating a Loop Template Diagram
When creating a loop within a Bridging transaction, you need to design a transaction template for the loop in the Template Designer, opened from the desired transaction's configuration.
The following procedure uses the Orders table of the Northwind sample database and posts one audit event per order. Substitute your own reader and the activity that you want to repeat.
To create a loop template diagram:
-
In the Template Designer on the Template Diagram tab, select Data Set Reader from the Activities Library in the left panel and drag it onto the Diagram Editor.
-
In the right panel, complete the following settings for the data set reader:
-
In General Settings in Activity Name, enter Orders.
-
In Data Source, click
 , browse to Data Connectivity > Databases > SQL Server > Northwind, expand Data Sources, and select Orders.
 -
In the Data Filter section, enter the following expression to keep the first test short:
x=like({{column:ShipCountry}}, "Norway", 0)The Northwind Orders table contains several hundred rows, and the loop runs once for each of them. The data filter only allows the reader to reach a few rows.
-
-
In the Activities Library, select a Condition activity and add it after the reader.
-
In the right-panel settings, name the condition activity More Rows?, and in Condition Settings, set its condition expression to test whether the counter has reached the end of the dataset:
x={{bwx:local@Counter.Row[0].Col[0]}} < {{ActivityOutput:Orders.RowCount}} -
Drag Audit Events Output activity onto the diagram and complete the following settings.
-
In Activity Name, enter Log Order.
-
In Message, click
 and enter the following, which addresses the current row with
 getoutputcell, using the counter as the row index:x="Order " + getoutputcell("Orders", {{bwx:local@Counter.Row[0].Col[0]}}, "OrderID") + " ships to " + getoutputcell("Orders", {{bwx:local@Counter.Row[0].Col[0]}}, "ShipCity")
This is the activity which the loop repeats, and it reports one order on each pass.
-
-
Right-click More Rows?, select Add <True> Link, and drag the link onto Log Order.
-
Add a Real Time Output activity after Log Order and complete the following settings.
-
In Activity Name, enter Increment Counter.
-
In Data Source, add a new item and in the Point Name column, enter bwx:local@Counter.Row[0].Col[0].
-
In the Output Expression column, enter:
-
The counter doubles as the row index, so no adjustment is needed—dataset rows are zero-based, and the counter starts at 0. Learn more
-
Right-click Increment Counter, select Add <Completed> Link, and drag the link back onto More Rows?. This closes the loop.
-
Connect the On False path of More Rows? to an End activity, confirm that the Validation Log reports no errors, and then click Apply. The completed transaction diagram should resemble the following image:
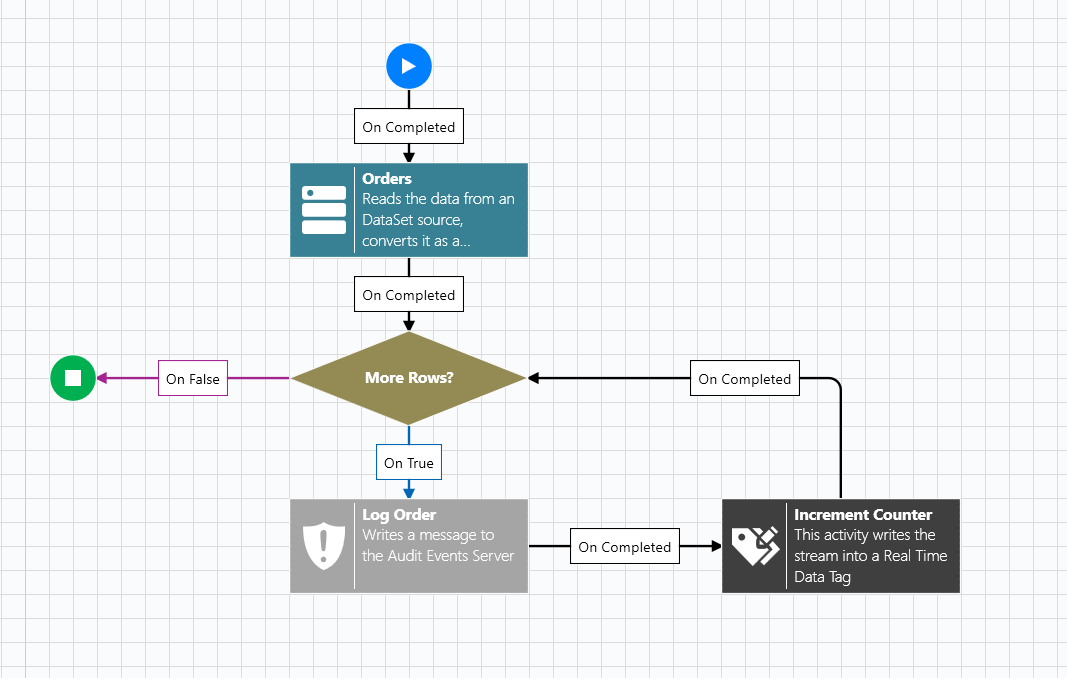
You can rearrange activity blocks and lines as you wish to improve the readability of a transaction. Ctrl-click on a line to add a way point to it that can help to organize the paths.