Visualizing BACnet Trends
If you have configured logging trends for a BACnet channel or for individual devices, you can visualize the collected trend data using the Trend Viewer in GraphWorX or the Data Explorer in GraphWorX or as a stand-alone tool. The following procedure describes displaying the trends in the Data Explorer in GraphWorX.
To view the trends in Data Explorer in GraphWorX:
- Open GraphWorX in the configuration mode (default).
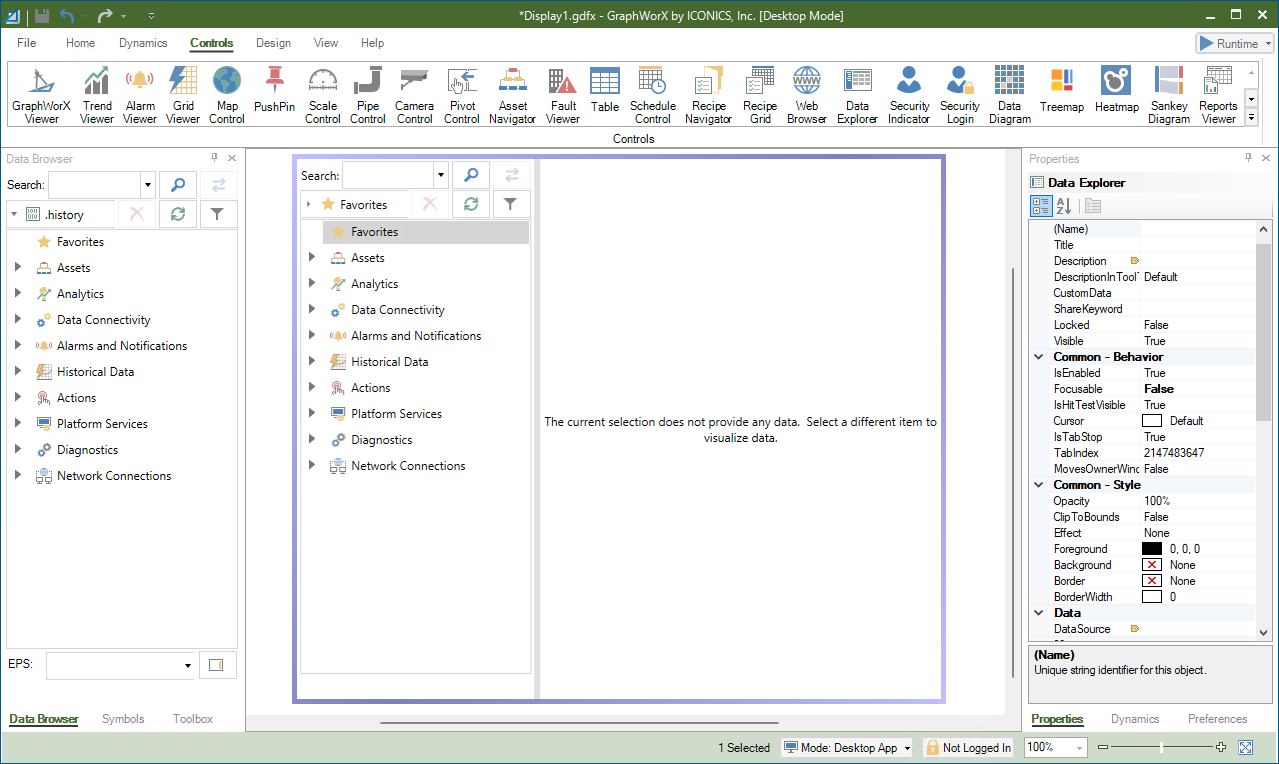
- On the Controls ribbon, select Data Explorer, and then drag the mouse diagonally across the canvas to make a rectangle for inserting the Data Explorer control.
-
Double-click anywhere inside the control to activate its options. The activated mode is indicated by a violet rectangle around the display.
- In the left pane, go to Data Connectivity > BACnet, and then expand the desired channel and device.
-
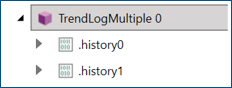
Expand the desired TrendLog or TrendLogMultipleobject, and double-click the .history data point (tag) to subscribe to it.
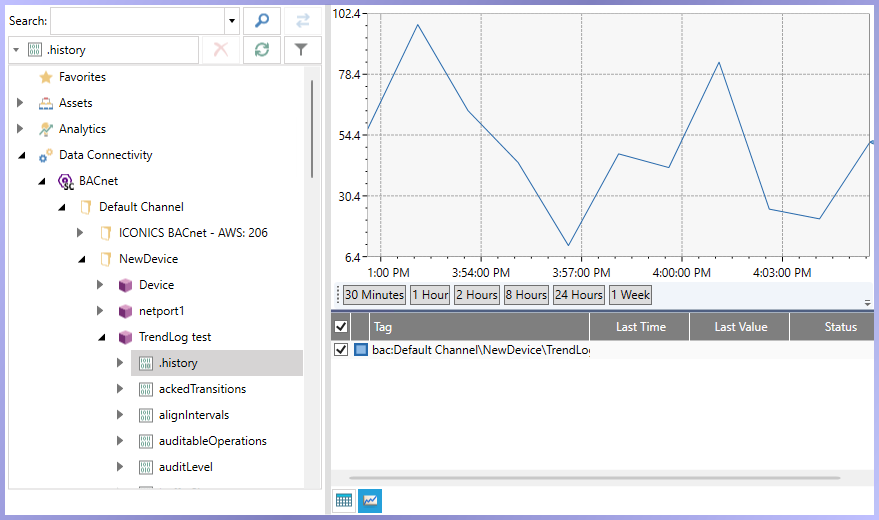
Multiple trend data points are displayed as .history0 to .history<X> where <X> is the number of configured trends in the TrendLogMultiple object.
- Select one of the options below the graph to determine the period for which you want to display the trends (from 30 minutes up to 1 week).
-
Change the default Interpolative filter (aggregate) to Raw Data to make sure you see the real values. Do the following:
- Double-click anywhere in the graph section to open the configuration.
- In the left pane of the Configure Your Control dialog, select Pen.
-
In the right pane on the General tab, click
 next to the Connection field, and select Configure.
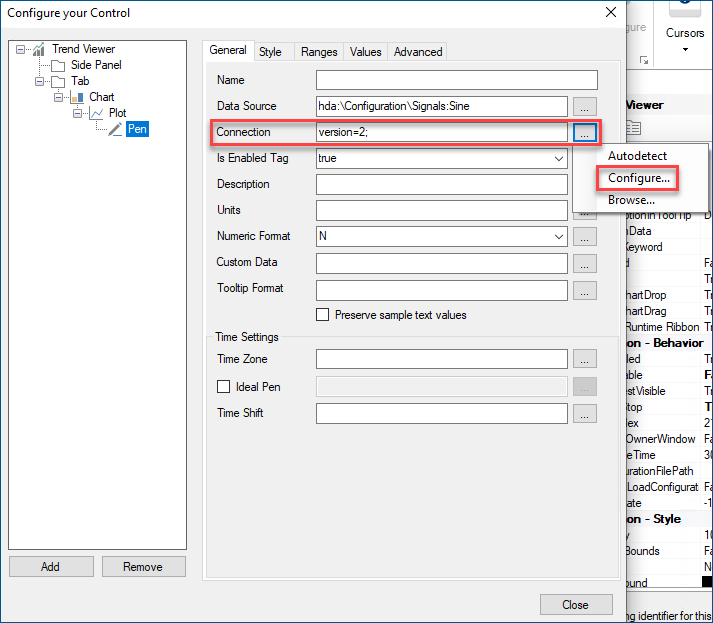
- In the Connection Configuration dialog, select Use HDA Connection.
- In the Filter drop-down menu, select (raw data), and then click OK. Then close the configuration dialog.
- Use
 and
and  at the bottom of the left pane to switch between a grid view with details about the data point and a graphic trend view.