Configuring Twilio Logging Options
You can set up two types of logging for Twilio in Workbench—fetching the debug logs from the Twilio console and logging Twilio alerts in a database in GENESIS.
Debug Logs
The debug logs are fetched from the Twilio console, and they are mainly helpful in debugging webhook errors. You can fetch the logs and set up the details in the Twilio Debug Logs section of the desired Twilio configuration under Alarms and Notifications > Alert Notifications > Twilio Configurations.
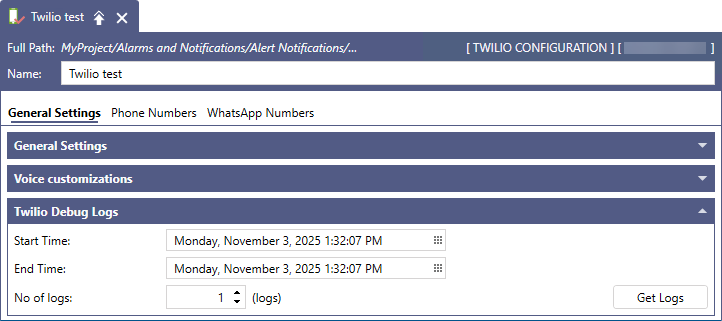
To retrieve the logs, enter the desired parameters in Start Time, End Time and the No of logs (the number of logs to be fetched), and then click Get Logs. The logs are traced in TraceWorX at the Normal trace level. If no trace is available to be fetched for the selected time period, it is traced as "No debug logs found for given time period and limit." at the Normal level.
Twilio Alerts Logging
Alert REST Service logs details of outgoing alerts as a runtime table in its configuration database. If you want to log Twilio alerts separately from the configuration database, you can create a custom database in Workbench under Alarms and Notifications > Alert Notifications > General Settings in the Logging Settings section.
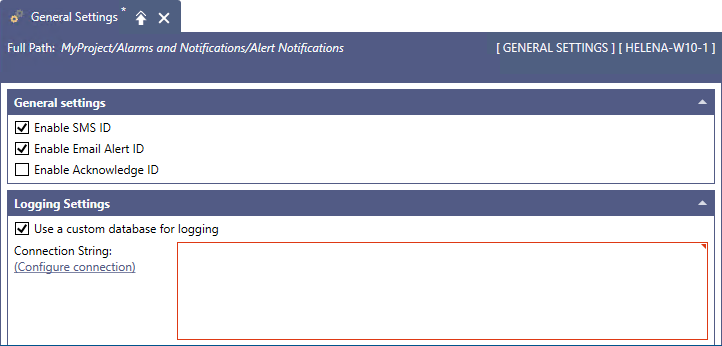
To do this, select the Use a custom database for logging checkbox, and then click Configure connection to open the Connection Settings dialog. In Database, select the desired database, and then click Next to close the dialog. The connection settings are displayed in the Connection String text box. Click Apply to save the configuration. The details on Twilio alerts are logged in the ALERT_RestCallLogs table.