Adding and Using Alarm Server Counters
Alarm counters are real-time, configurable process points exposed from the Alarm Server that appear under each Area and directly in the root. They count the number of alarms or determine the alarm severity based on a condition that matches the configured expression.
The Alarm Server counters behave the same way as the alarm counters in Assets. If you have interacted with the counters in Assets before, the Alarm Server counters should be familiar.
All alarm sources under an Area, single or nested, are eligible to be counted by a counter. Alarms must not be in the Inactive Acknowledged state; in this state, the alarm disappears from the Alarm Viewer. The Alarm Server only processes alarm counters that the client component scans. Counters that are not read by a client do not consume any resources. A new value gets counted every second, regardless of the scan rate requested by the client.
Adding Counters
In the default configuration, some counters already exist and can be exposed as process points to clients. Some examples include the count of active and acknowledged alarms (ActiveAckedCount) and the maximum severity of active and acknowledged alarms (ActiveAckedMaxSeverity). You can also add a custom counter.
To add a custom counter:
-
Open Workbench. In the Project Explorer, expand your project > Alarms and Notifications > Alarm Server > Product Configuration, and then right-click Counters and select Add Counter.
-
In Name, enter a unique identifier for the new counter. You can add a description for the counter, but you are not required to.
-
Click
 next to the Alarm Filter field to open the expression editor and enter an expression. For example, select Variables from the buttons on the right side, choose a Field, and then configure the expression.
 -
Select the Counter type from the dropdown list:
-
Simple count—The counter returns the number of alarms that match the expression. You do not have to set the Value expression; when Simple count is selected, the Value field is inaccessible.
The expression should be a Boolean value or converted into a Boolean. Based on the result, the counter determines whether to include the alarm. For example, a Simple count expression could be x=({{ae:/:/Area1.Source1@NewState}} & 1) == 1.
-
All other Counter types (Maximum, Minimum, Range, Average, and Sum)—The counter returns the specific severity of all the alarms that match the expression. When you select a Counter type other than Simple count, you must set the Value expression; after selecting one of the Counter types, the Value field becomes accessible. Click
next to the Value field to open the expression editor and enter an expression directly into the configuration or choose from the buttons on the right side.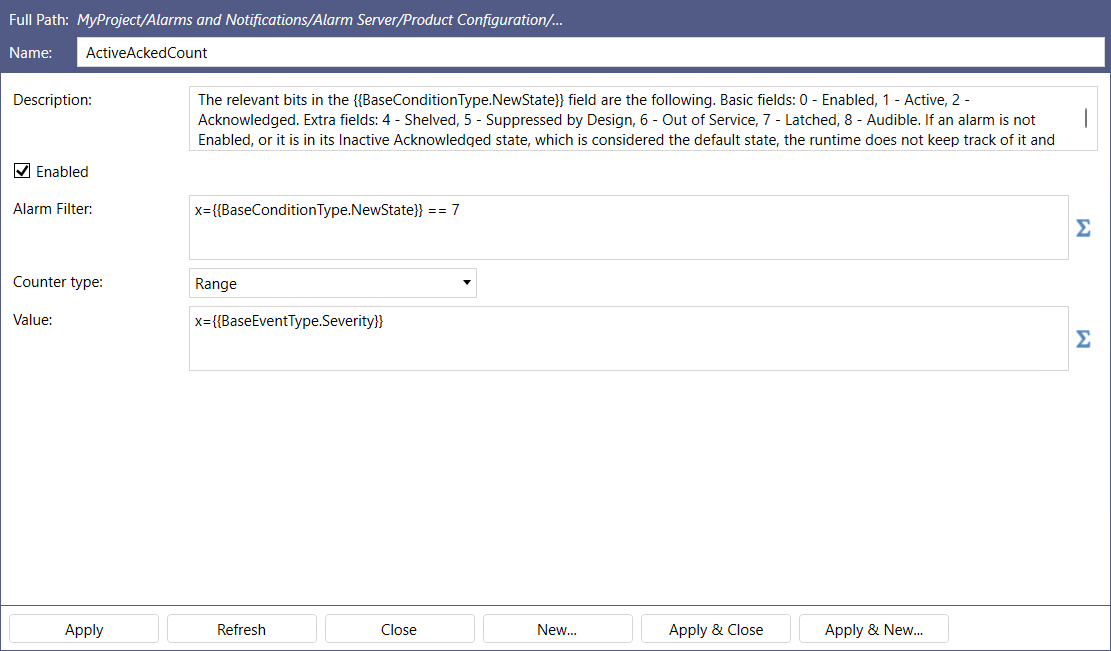
If no alarms match, the value of the counter appears empty.
-
-
Click Apply, and the custom counter appears under the Counters node.
The counters are automatically calculated at every level of the alarm hierarchy.
Using a Counter Value in a GraphWorX Display
In a GraphWorX display, you can visualize a counter value in runtime. Open GraphworX and, on the top ribbon, select Process Point. Then, click into the canvas and drag the mouse to create a rectangle for inserting the process point.
Click on the process point control and, on the right Dynamics panel, select the DataSource field to open the Data Browser. On the Data Points tab, expand Alarms and Notifications > Alarm Server and select a counter as the data point. Then, click OK.
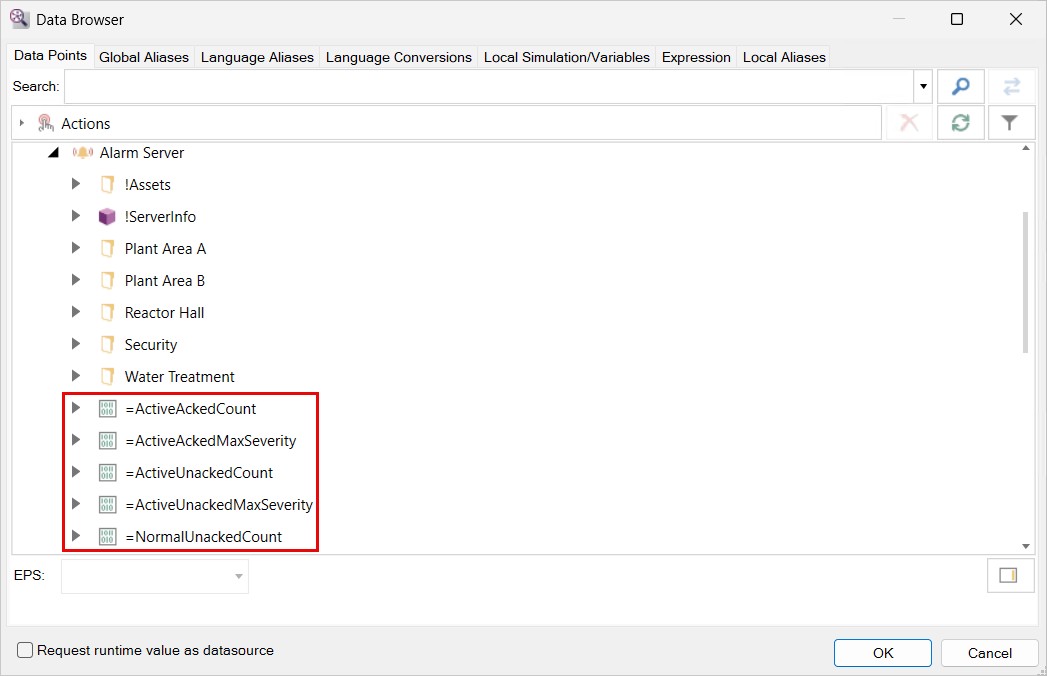
The counter counts active alarms that are visualized in runtime.