IoTWorX Analyzer
The IoTWorX Analyzer provides edge analytics with built-in ICONICS fault detection. The following shows how to configure IoTWorX faults in AssetWorX and how to establish an Analyzer connection on your IoTWorX device.
Note: The IoT Analyzer Point Manager module must be deployed. See Deploying ICONICS Modules to the Device for more details.
Add IoT Analyzer Components to IoT Project
First, we will add the necessary components to the IoT project to use IoT Analyzer on one or more devices.
-
In Workbench, go to your IoT project > Device Templates > Default Template > Internet of Things > Analyzer Group.
-
Add a new analyzer group.
-
Give the group a name.
-
Apply the changes.
-
Go to Internet of Things > Loggers.
-
Add a new logger.
-
Give the logger a name.
-
Apply the changes.
-
Go to Internet of Things > Publish Lists.
-
Add a new publish list.
-
Give the publish list a name.
-
For Default Collection Group, select a collection group. If you have no collection groups, click the plus (+) button to automatically create one.
-
For Default Logger, choose the logger created earlier.
-
For Analyzer Group, choose the analyzer group created earlier.
-
Apply the changes.
-
Go to Internet of Things > Publisher Connections.
-
Add a new publisher connection.
-
Give the publisher connection a name.
-
Go to the General Settings section.
-
Set Connection Type to Platform Services.
-
For Publish List, select the publish list created earlier.
-
Go to the Platform Services Settings section.
-
For Publish Machine Name, enter the DNS name or IP address of your remote FDDWorX or Facility AnalytiX server.
-
Apply the changes.
-
Expand Internet of Things > Nodes.
-
Edit Publisher Nodes.
-
Add a new entry to the list.
-
For Machine Name, enter the Device ID of your edge device.
-
For Publisher Connection, choose the publisher connection we created earlier.
-
Apply the changes.
Configured Fault Definition

Define Faults to be Processed by IoT Analyzer
The next steps will configure the fault rules that will be processed by IoT Analyzer running on the IoTWorX edge device.
-
In Workbench, go to your local (non-IoT) project > AnalytiX > FDDWorX > Fault Diagnostic Models.
-
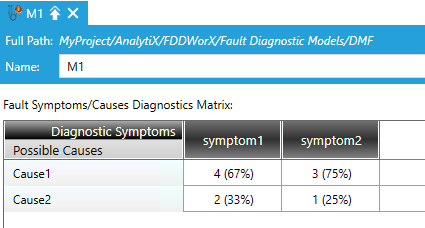
Create a new fault diagnostic model as you would for a standard FDDWorX or Facility AnalytiX application.
Fault Diagnostic Model

-
Expand your local (non-IoT) project > Assets.
-
Find an asset you would like to add FDDWorX to and edit it.
-
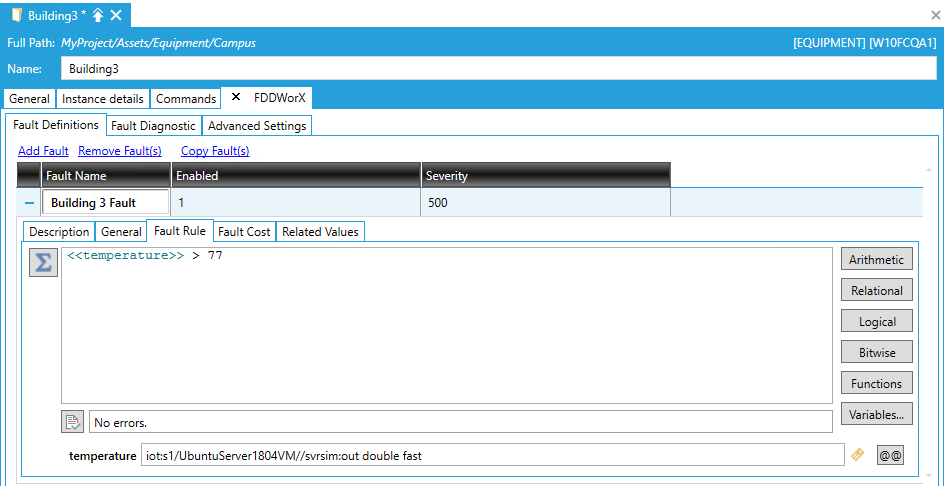
Use the plus ("+") tab to add the FDDWorX extension. Under FDDWorX > Fault Definitions, define a fault rule. Use aliasing to place hold for tags that will be evaluated on the device, then browse to them.
Example Fault Definition

-
If you plan to use diagnostics:
-
Go to the Fault Diagnostic tab
-
Select your Diagnostic Model and fill in the mappings as appropriate. Only Expression-based diagnostic symptoms can be used to configure fault diagnostics. (Alarm-based symptoms are not supported.)
-
Go the FDDWorX > Advanced Settings tab.
-
Enable IoT Asset.
-
For IoT Device Tag, use the browse button choose the device to process this fault.
-
Select OK in the tag browser.
-
Apply your changes.
-
Select Update IoT Configuration.
-
Select the database where the IoT template is configured (not where you have configured FDDWorX).
-
Select Next.
-
For Select existing Group, choose the analyzer group that was created earlier.
-
Select OK.
-
You should receive a message that the IoT configuration database was successfully updated. Select OK.
-
Apply the changes to the asset.
Finalizing Deployment
Now that FDDWorX is configured and the necessary IoT Analyzer components have been added to the IoT project, we can deploy the settings to the device.
-
Start the FDDWorX service if it is not already started.
-
In Workbench, expand to your IoT project > Default Group.
-
Right-click your device and select Deploy Device(s) Configuration.
-
Once the deployment completes, IoT Analyzer on the edge device will begin to process the fault rules. If a fault incident occurs, it will be logged on the device and then merged to your remote FDDWorX server at the rate defined in your publish list. You can view the fault incidents using a Fault Viewer as you would faults for non-IoT assets.
IoT Analyzer Fault Incidents Available as Alarms
IoT Analyzer fault incidents are available as alarms.
To see to fault incident alarms in the IoT Visualizer, add an alarm widget and configure it to subscribe to AnalytiX > IoT Analyzer > your analyzer group name. The resulting alarm point should look like analyze:GroupName.
See Also: