Types of Data Sources
ReportWorX supports the following data sources:
You can add a data source by using the Add > Data source option available in the ReportWorX Express ribbon and in the context menu.
You can add a parameter data source by using the Add > Parameter source option available in the ReportWorX Express ribbon and in the context menu.
It is also possible to add data source by dragging and dropping the tag from the lateral data browser, to do that, you must click on the Open lateral data browser option available in the ReportWorX Express ribbon and in the context menu, then drag the tag that you want to add to your report.
Dataset
Dataset Data Source Configuration
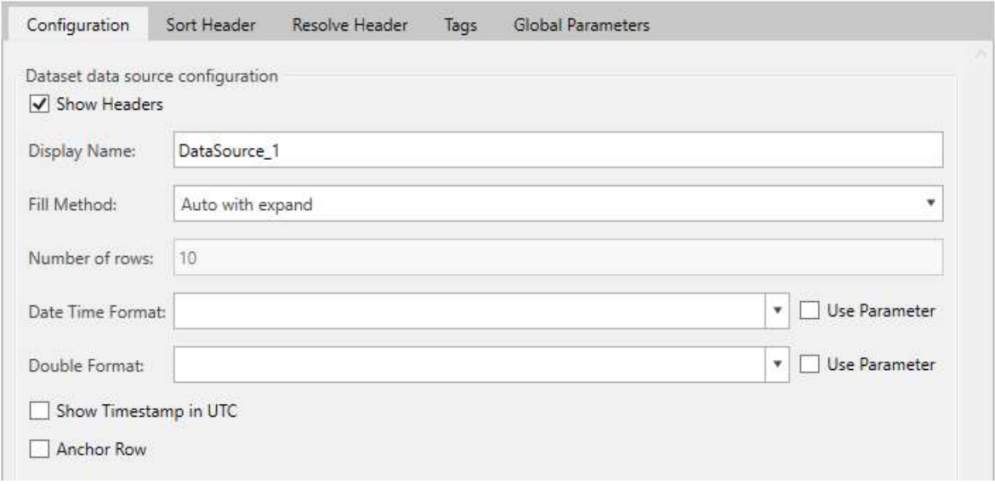
The dataset data source does not have any additional fields. It only supports one tag.
The dataset data source does not have any predefined header. They depend on the tag.
Datasource may also be referred as DS source.
Parameter
Parameter Data Source Configuration

The parameter data source does not have any additional fields.
The parameter data source does not provide tag configuration.
There is no way to change the parameter associated to the parameter data source; you must delete the current data source and add a new one.
The parameter data source’s headers are the following:
-
{{Name}} : Name
-
{{DisplayName}} : DisplayName
-
{{Description}} : Description
-
{{DataType}} : DataType
-
{{ParameterType}} : ParameterType
-
{{Value}} : Value
They do not depend upon the paramerer, every parameter data source will you the previously listed headers.
Parameter data source are always referred only as parameter data source.
Realtime
Realtime Data Source Configuration
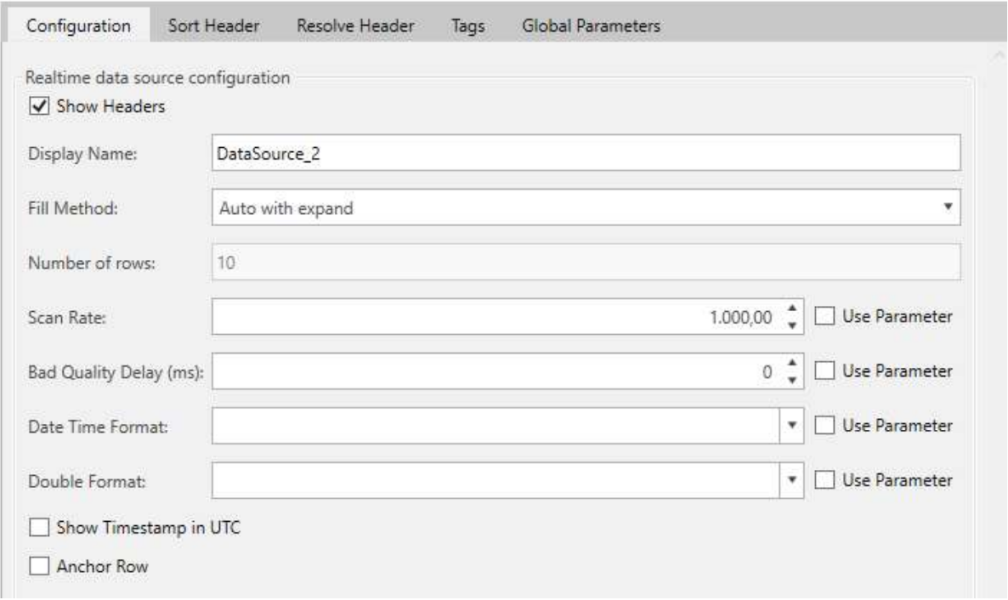
The realtime data source supports multiple tags.
The realtime data source provides additional settings:
Scan rate – specifies the sampling rate in milliseconds, it specifies the amount of time that must elapse to get a sample, you can bind a parameter to this field to customize the report before running it or to use a shared value across multiple data sources.
Bad quality delay – specifies an amount of time in milliseconds that should be awaited before returning a bad quality data, you can bind a parameter to this field to customize the report before running it or to use a shared value across multiple data sources.
The realtime data source’s headers are the following:
- {{PointName}} : PointName
- {{Value}} : Value
- {{Quality}} : Quality
- {{Timestamp}} : Timestamp
They do not depend upon the tag, every realtime tag will provide you the previously listed headers.
Realtime data source may also be referred as DA source.
Historical Data
Historical Data Source Configuration

The historical data source is quite complex and has various option.
Start date- the date and the hours that specifies from which point you want to start retrieving the historical data, you can bind a parameter to this field to customize the report before running it or to use a shared value across multiple data sources. Start date must be antecedent to End date.
End date – specifies the data and the hours that specifies at which point you want to stop retrieving the historical data, you can bind a parameter to this field to customize the report before running it or to use a shared value across multiple data sources.
End date must be consequent to Start date.
Aggregate name – specifies the way data must be aggregated, you can bind a parameter to this field to customize the report before running it or to use a shared value across multiple data sources. Note that if you bind a parameter to the aggregate name, the parameter must be of type string, and the parameter value must be the English name of aggregate, check the fixed parameter list preconfigured aggregate name list if you have doubt.
The available and supported aggregate are the following:
-
None
-
Interpolative
-
Average
-
Time average
-
Total
-
Minimum
-
Maximum
-
Minimum actual time
-
Maximum actual time
-
Range
-
Aggregate count
-
Sum
-
Count
-
Delta
-
Duration good
-
Duration bad
-
Percent good
-
Percent bad
-
Worst Quality
-
Delta bound
-
Duration in state non zero
-
Duration in state zero
-
End
-
End bound
-
Maximum 2
-
Maximum actual time 2
-
Minimum 2
-
Minimum actual time 2
-
Number of transition
-
Std dev population
-
Variance population
-
Range2
-
Std dev sample
-
Variance sample
-
Start
-
Start Bound
-
Time average 2
-
Total 2
-
Worst quality 2
Processing range - specifies the unit of time for the aggregate, the available values are the following:
-
Days
-
Hours
-
Minutes
-
Seconds
Processing time – based on the processing range specifies the number of days/hours/minutes or seconds for the aggregate, you can bind a parameter to this field to customize the report before running it or to use a shared value across multiple data sources.
Show bad quality data – if enabled the bad quality data are going to be shown, otherwise are not returned.
Column style – specifies the column style of the data source, the available values are: Simple and Extended, the column style is treated in deep after the use back-filling field.
Use back-filling – if enabled it fills an empty/null value with the latest retrieved value, it can be activated only if the aggregate name is None.
This feature also works with multiple tags.
If the first row returned is empty/null, an out of bounds value is going to be retrieved in order to avoid an empty dataset.
Based on the column style that you choose, the headers may or may not depend upon the tag(s).
If column style is set to Extended, the headers are the following:
-
{{PointName}} : PointName
-
{{Value}} : Value
-
{{Quality}} : Quality
-
{{Timestamp}} : Timestamp
-
{{Name}} : Name
-
{{DisplayName}} : DisplayName
-
{{Description}} : Description
-
{{LowRange}} : LowRange
-
{{HighRange}} : HighRange
-
{{EngineeringUnits}} : EngineeringUnits
In this case, the header do not depend upon the tag(s).
If the column style is Simple, the headers are structured as follow:
-
{{Timestamp}} : Timestamp
-
{{Encoded_Pointname0}} : Encoded_Pointname0
-
{{Encoded_Pointname1}} : Encoded_Pointname1
...
-
{{Encoded_PointnameN}} : Encoded_PointnameN
In this case, the headers depend upon the tag(s).
If you add a new data source, it is going to be added with column style set to Simple, if you select two or more tags, otherwise if you select only one tag the column style is going to be set to Extended.
The historical data source may also be referred as HDA data source.
Historical Alarm
Historical Alarm Data Source Configuration

Start date- the date and the hours that specifies from which point you want to start retrieving the historical alarm data, you can bind a parameter to this field to customize the report before running it or to use a shared value across multiple data sources. Start date must be antecedent to End date.
End date – specifies the data and the hours that specifies at which point you want to stop retrieving the historical alarm data, you can bind a parameter to this field to customize the report before running it or to use a shared value across multiple data sources. End data must be consequent to Start date.
Event filter – allows you to write an expression to filter the data that are going to be retrieved, you can bind a parameter to this field to customize the report before running it or to use a shared value across multiple data sources. In the event filter you can reference other parameters. Keep in mind that some functions cannot be used in the event filter, the expression editor that pops up when you click the … button is going to show you the supported the functions, but you can still write, manually, an expression that involves an unsupported function.
Event fields – by clicking on the … button you can configure the headers that are going to be shown in the report.
The base headers for the historical alarm data source are the following:
- {{BaseEventType.EventClass}} : BaseEventType.EventClass
- {{BaseEventType.EventType}} : BaseEventType.EventType
- {{BaseEventType.Message}} : BaseEventType.Message
- {{BaseEventType.Severity}} : BaseEventType.Severity
- {{BaseEventType.SourceName}} : BaseEventType.SourceName
- {{BaseEventType.Time}} : BaseEventType.Time
- {{BaseConditionType.AckRequired}} : BaseConditionType.AckRequired
- {{BaseConditionType.ActiveTime}} : BaseConditionType.ActiveTime
- {{BaseConditionType.StatusCode}} : BaseConditionType.StatusCode
- {{BaseConditionType.SubConditionName}} : BaseConditionType.SubConditionName
- {{BaseConditionType.ConditionName}} : BaseConditionType.ConditionName
- {{BaseConditionType.NewState}} : BaseConditionType.NewState
- {{BaseConditionType.OriginalSource}} : BaseConditionType.OriginalSource
- {{OpcAEType.Category}} : OpcAEType.Category
The headers do not depend upon the tag.
Historical alarm data source may be referred as HA data source.
Fault
Start date - the date and the hours that specifies from which point you want to start retrieving the data, you can bind a parameter to this field to customize the report before running it or to use a shared value across multiple data sources.
Start date must be antecedent to End date.
End date – specifies the data and the hours that specifies at which point you want to stop retrieving the data, you can bind a parameter to this field to customize the report before running it or to use a shared value across multiple data sources.
End data must be consequent to Start date.
Retrieve children
There are two types of Fault headers, type 1 headers are the following:
-
{{CauseID}} : CauseID
-
{{CauseRank}} : CauseRank
-
{{CauseText}} : CauseText
SPC Chart
SPC Chart Data Source Configuration
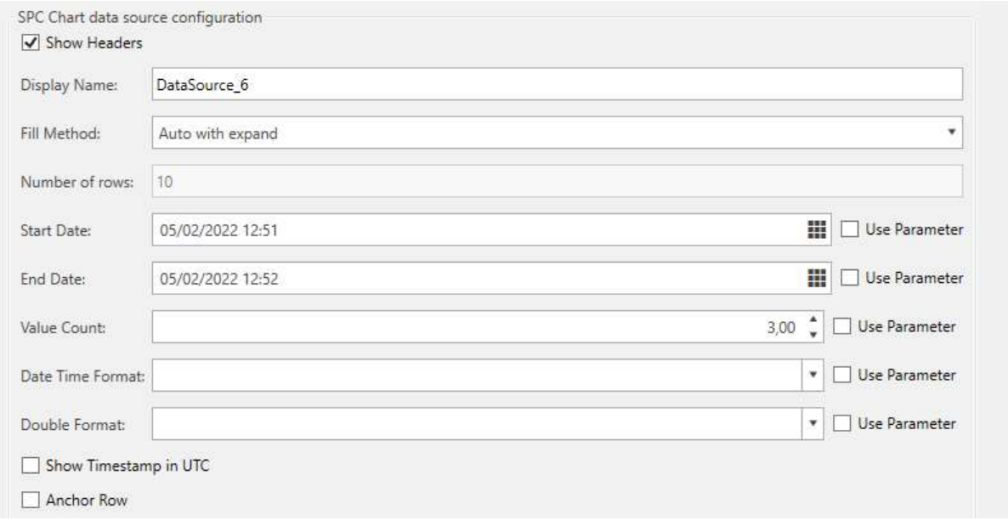
Start date- the date and the hours that specifies from which point you want to start retrieving the data, you can bind a parameter to this field to customize the report before running it or to use a shared value across multiple data sources.
Start date must be antecedent to End date.
End date – specifies the data and the hours that specifies at which point you want to stop retrieving the data, you can bind a parameter to this field to customize the report before running it or to use a shared value across multiple data sources.
End data must be consequent to Start date.
Value Count – specifies the number of samples that you want to retrieve for the interval of time specified.
The headers are not dependent upon the tag, the headers are the following.
- {{Alarm}} : Alarm
- {{CL}} : CL
- {{GroupId}} : GroupId
- {{LCL}} : LCL
- {{LSL}} : LSL
- {{Message}} : Message
- {{UserName}} : UserName
- {{Target}} : Target
- {{Timestamp}} : Timestamp
- {{UCL}} : UCL
- {{USL}} : USL
- {{Value}} : Value
SPC Hist
SPC Hist Data Source Configuration
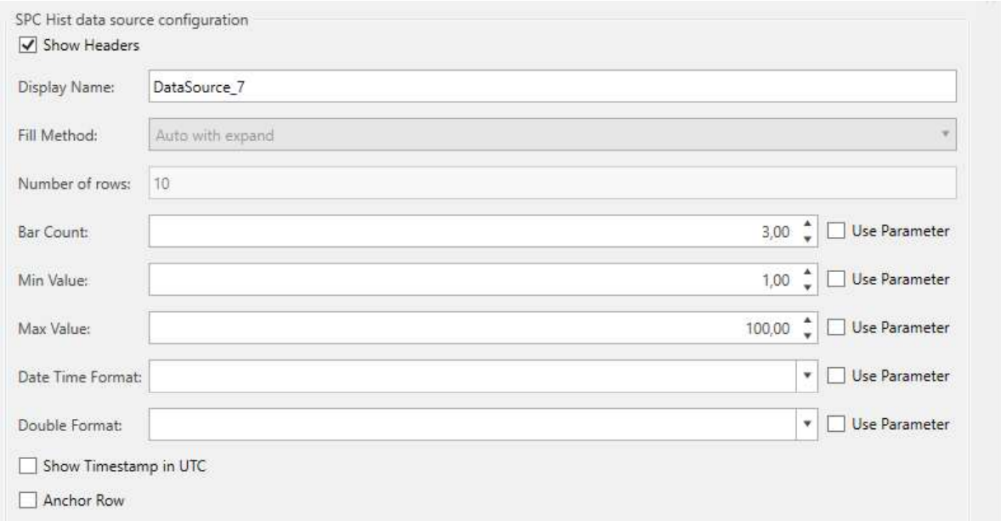
Bar count – specifies the number of intervals in which you want to calculate the statistics, it also represents the number of histograms you want to create.
Min Value – the lower bound of the interval of the distribution.
Max Value – the upper bound of the interval of the distribution.
The headers are not dependent upon the tag, the are the following:
-
{{PointName}} : PointName
-
{{LSL}} : LSL
-
{{USL}} : USL
-
{{Target}} : Target
-
{{Distribution}} : Distribution
-
{{Value}} : Value
-
{{MinimumRange}} : MinimumRange
-
{{MaximumRange}} : MaximumRange