Data Source Editing - Worksheet Level
Once a data source has been added to the worksheet, it is possible to customize by adding columns, removing columns, transposing the data source and adding chart settings.
Change the position of a column
To change the position of a column in a data source, you can use the dropdown list available in the first row of the data source.
For example:
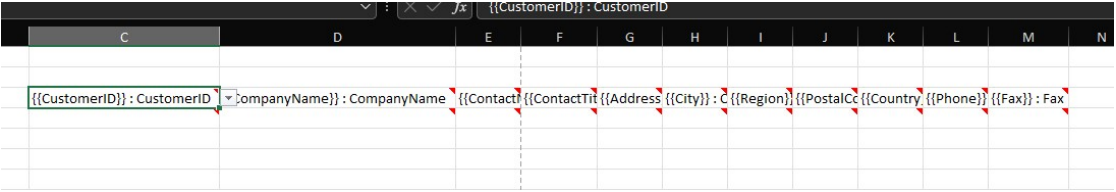
If we want to exchange the position of CustomerID and Fax, we can select the CustomerID cell. To do it,
1. Click on the dropdown.
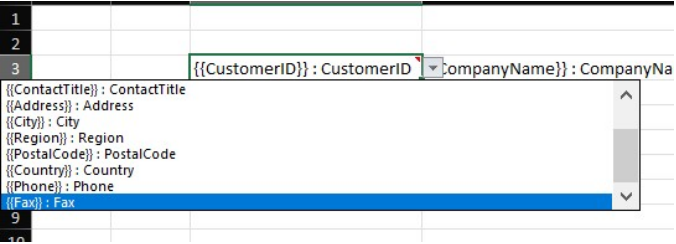
2. Select the "Fax" column.
3. In this case, we can do the same with the Fax column on the right. But this time, we are going to select "CustomerID".
Adding a New Column
Three Options How to Add a New Column
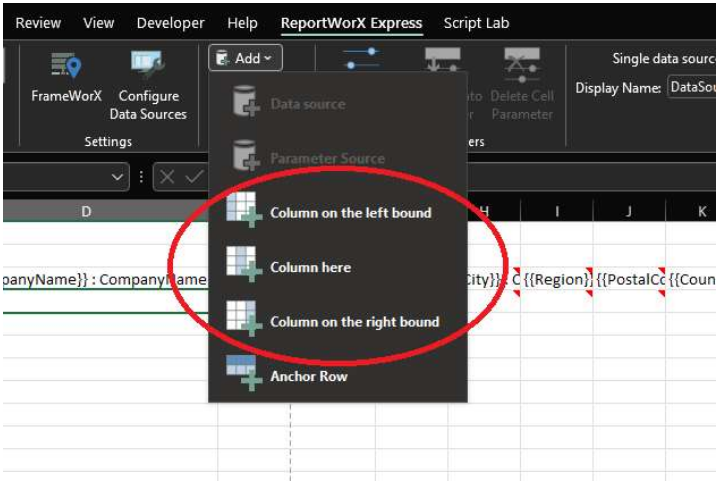
If you want to add a new column to a data source, we have three options:
- Add > column on the left bound - Provides a convenient way to add a column on the left bound of the data source without moving the selection to its left bound.
- Add > Column here - Adds the new column in the currently selected position of the data source.
- Add > Column on the right bound - Provides a convenient way to add a column on the left bound of the data source without moving the selection to its right bound.
Those three options are available from the ReportWorX Express ribbon and from the context menu.
Once you click on one of the three options, a dialog box will pop up.
Adding a New Column
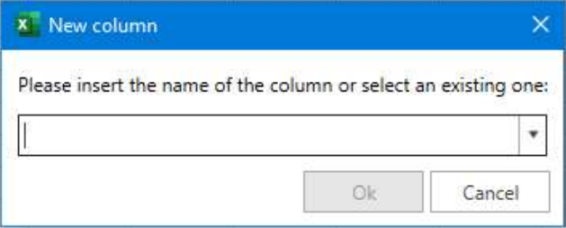
You can choose to add an already existing column, to add a previously removed column or to add a custom column.
If you want to add an already existing column or add a previously removed column, you can write column’s name or select it from the drop down list available.
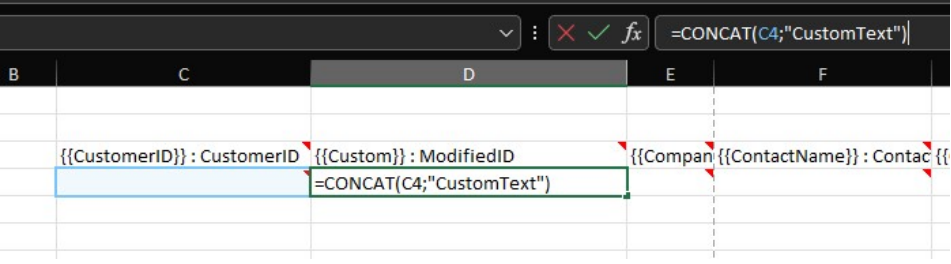
In case you want to add a custom column you have to write the name you want to provide to the custom column, you can write in two way: by directly adding the {{Custom}} : YourColumnNameHere, or just by writing the name without “{{Custom}} : “.
Note that if you only write the name of the column, it is going to be treated as a custom column.
If you have added a custom column, you can now write a formula in the cell under the header.
Writing a Formula in the Cell
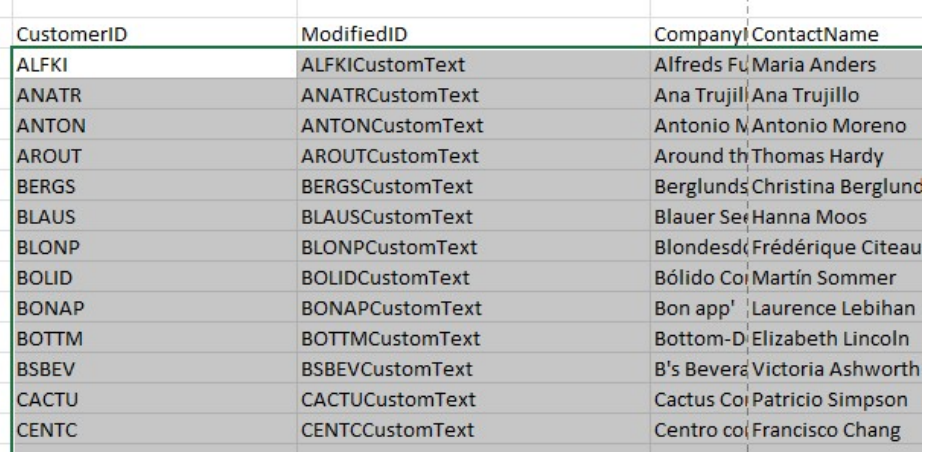
And if you perform the download, you can notice that the expression has been expanded for all the retrieved data rows.
Anchor Row
Adding the Anchor Row
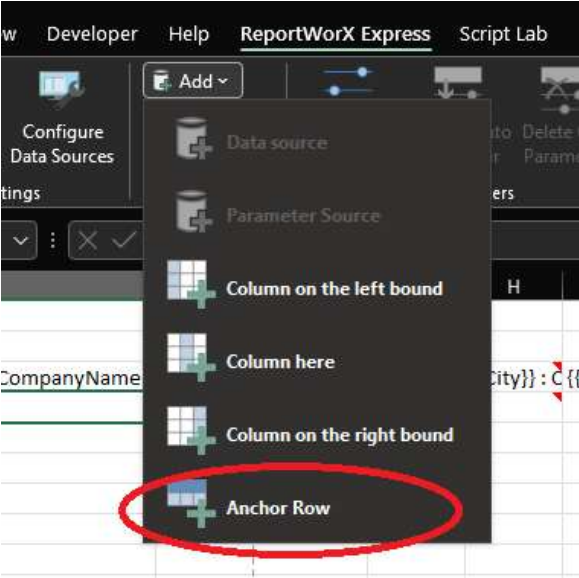
To add the anchor row to a data source, you can use the Add > Anchor Row option available in the ribbon and in the context menu.
Once you’ve added the anchor row you can add a formula in it.
The anchor row is meant to provide you a way to add aggregation formulas for a data source, let’s see an example to clarify:
Adding Aggregation Formulas for a Data Source
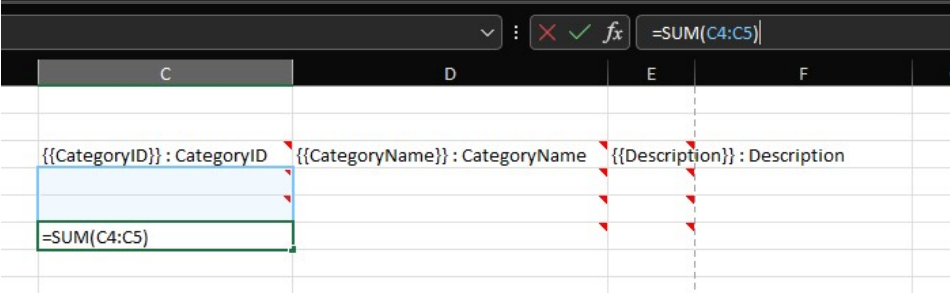
When you download the data, you can notice that the formula has been updated to target the whole column.
While dealing with the anchor row, keep in mind that you can also target values from another column.
And you can also reference external cells if needed.
But keep in mind that external cells are not going to be updated, they are treated like a constant in the formula.
Transpose a Data Source
If you want to transpose a data source, you can use the Edit > Transpose option available from the ReportWorX Express ribbon and the context menu.
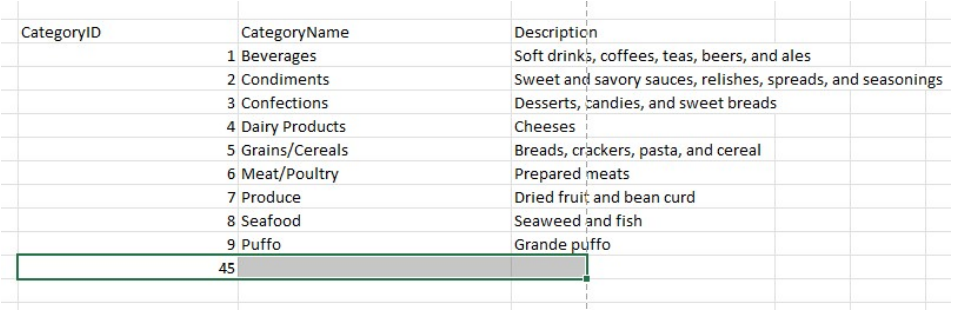
Once the data source is transposed, the rows are exchanged with the columns and the data source appears in this way:
![]()
You can transpose the data source again if you want to go back.
Edit the Headers
Data source’s headers are not directly editable from the Excel worksheet since they must meet some rules that are easy to be broken if edited manually.
In order to customize the headers, ReportWorX Express provides you a window to edit the headers in a easy way.
In order to edit the data source headers, you can use the Edit > Headers option available from the ReportWorX ribbon and context menu
Once clicked, the Header configuration window will pop up.
Header Configuration Window
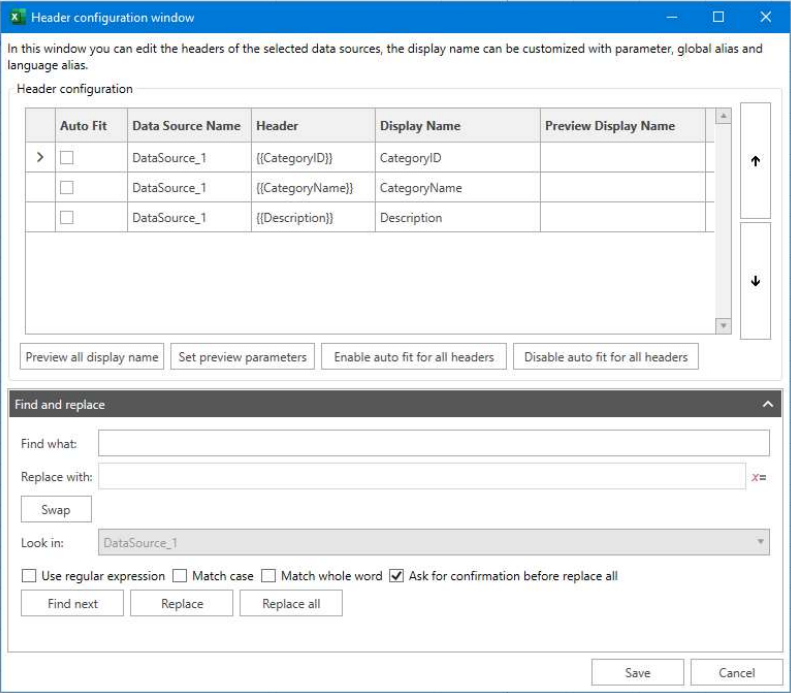
The header configuration window can work with a single data source and with multiple data sources, if you are dealing with more than one data source, the arrows on the right that can be used to change the position of the headers are not going to be enabled.
The autofit checkbox allows you to specify for which column the autofit operation should be performed. Data source name is not editable and is meant to give you a way to figure out which column are you editing while dealing with more than one data source.
The header is not editable and is meant to give you a way to figure out which column are you editing if you decide to change the display name to something different from the original header name.
The display name can be edited, and you can add parameters, global alias and language alias to it.
The preview display name is used to give you an idea of how the header is going to look when you’ll download the data.
The preview all display name button is going to calculate all the display name and show you the preview. The set preview parameters allow you to provide the value to the parameters currently used in the headers.
Enable autofit for all headers is going to check the auto fit checkboxes for all the headers.
Disable autofit for all headers is going to uncheck the auto fit checkboxes for all the headers.
With the aid of the "Find and replace", it also allows you to perform bulk operations on headers in case you are work with data sources with a huge number of headers.
Add Chart Setting
To add chart setting to a data source, you can use the Edit > Chart setting available from the ReportWorX ribbon and the context menu.
Once you click it, the data source chart configuration window will appear.
Data Source Chart Configuration
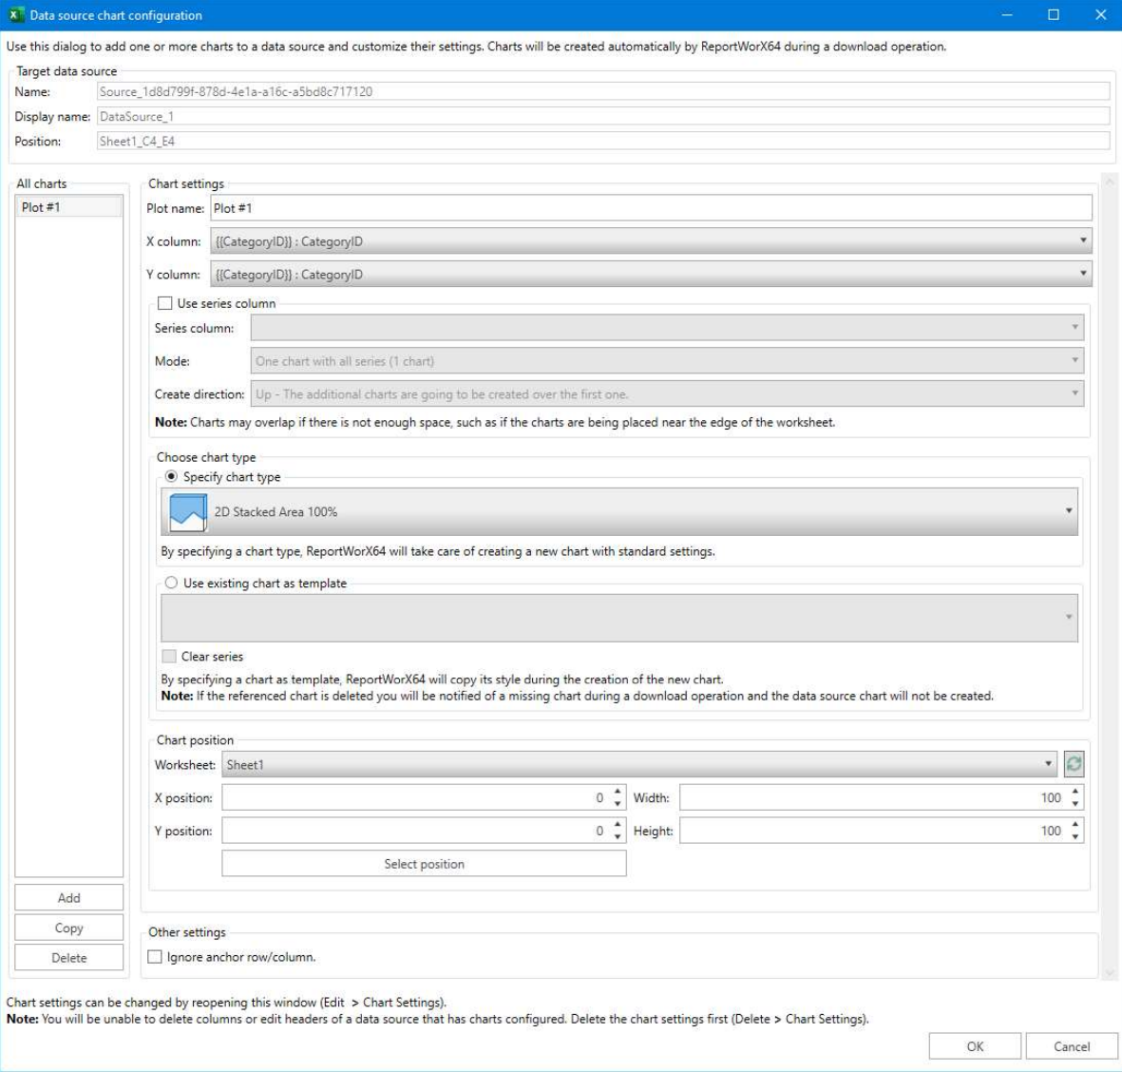
On the left side of the window, you can choose which charts you want to edit, you can add a new one or remove an existing one; if there is only one chart, you cannot delete it.
In the chart settings area of the window, you can specify the name of the chart and select the X and Y column.
The column series is a column that can be used to group together some data that shares a common trait.
Consider, for example, the following tables:
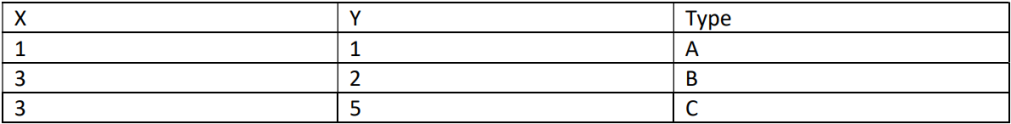

If you select the Type column as series column, ReportWorX Express is going to plot a chart and group together the data where the type is A, and the same for B and C.
You can also specify the chart creation mode, there are three modes:
-
Once cart with all series - It is going to create only one chart.
-
Each series in a separate chart - It is going to create N charts where N is the number of different values found in the series column
-
One chart with all series , plus each series in a separate chart - N+1 charts, a mix of the already mentioned mode.
It is also possible to choose in which direction the chart should be created:
- Up
- Left
- Right
- Down
In the Choose chart type section of the window, you can specify if you want to directly specify the chart type or if you want to reference an existing chart that is going to be used as a starting point.
If you’re using the chart series, the number of available charts is limited to:
- Scatter
- 2D Scatter with smooth line
- 2D Scatter with smooth line and markers
- 2D Scatter line
- 2D Scatter line with markers
By using a chart as template, you can inherit its style configuration.
If the chart that you inherit already has data, but you don’t want to keep the data check the Clear series checkbox.
In the chart position section, you can specify in which sheet the chart is going to be created and where the chart is going to be positioned.
Of course, you can also specify the width and height of the chart.
Once you add chart setting to a data source, you can’t change its tag, you can’t change the headers and you can’t remove columns.
In the other setting section, you can choose to ignore the anchor row data by enabling the Ignore anchor row/column checkbox.
Remove a Data Source
If you want to remove a data source, you have two options:
- Select the data source you want to remove, then use the Remove > Data source option available from the ReportWorX Express ribbon and the context menu.
- Select the whole area occupied by the data source and press the CANC key. (Note that you can just select all the headers.)
Remove a Column from a Data Source
If you want to remove a column from a data source, you have two options:
- Select the column you want to remove, then use the Remove > column option available from the ReportWorX Express ribbon and the context menu.
- Select the header cell of a column of a data source and press the CANC key. (Note that you can select and remove multiple columns.)
If you are dealing with a data source with only one column and you delete it, the data source is going to be removed.
If the data source has chart settings, you cannot delete columns.
Remove the Anchor Row
If you want to remove the anchor row from a data source, you can remove it by using the Remove > Anchor option available from the ReportWorX Express ribbon and the context menu.