Fault Diagnostic Tab
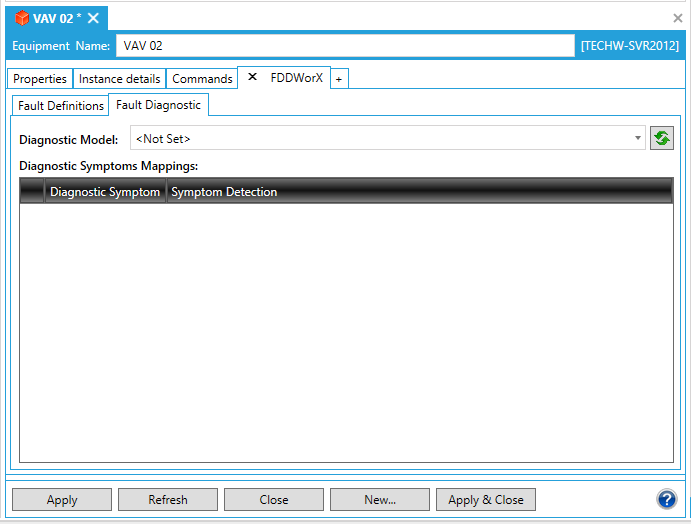
Once you have added the FDDWorX tab to the asset's Equipment form in AssetWorX (and then added faults through the Fault Definitions tab) you can add Diagnostic Symptoms Mappings. The image below shows the initial state of the Fault Diagnostic tab within the FDDWorX tab within the selected asset's properties.
|
|
Note: This tab is also available for equipment classes. All equipment classes are defined in AssetWorX in the Equipment Classes node. In AssetWorX, you can define and use equipment classes as templates for creating nodes in the asset tree. You can also use aliases in your equipment classes; these aliases will prompt you for actual properties for equipment as you use the equipment classes to define nodes in the asset tree. For more information, refer to the Introduction to Equipment Classes (Templates) and Creating Equipment Classes for Use as Templates topics. |
Fault Diagnostic Tab in the FDDWorX Tab in the Equipment Form in AssetWorX
To Select a Diagnostic Model
-
If you have already created at least one Diagnostic Model in the FDDWorX provider in the Workbench, you can select one by clicking on the pulldown menu at the top of the tab window, as shown below.
-
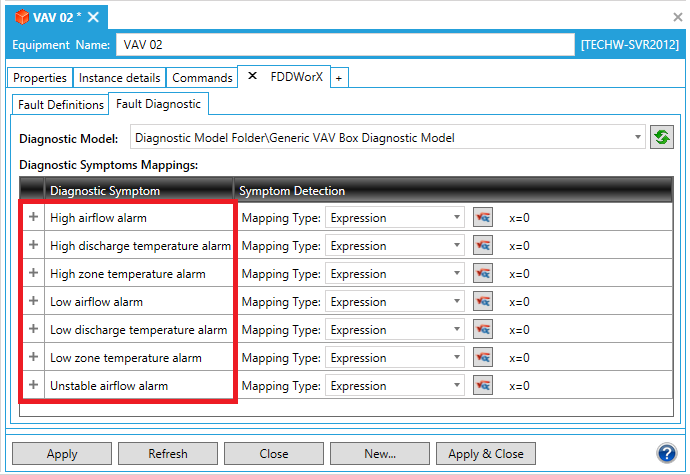
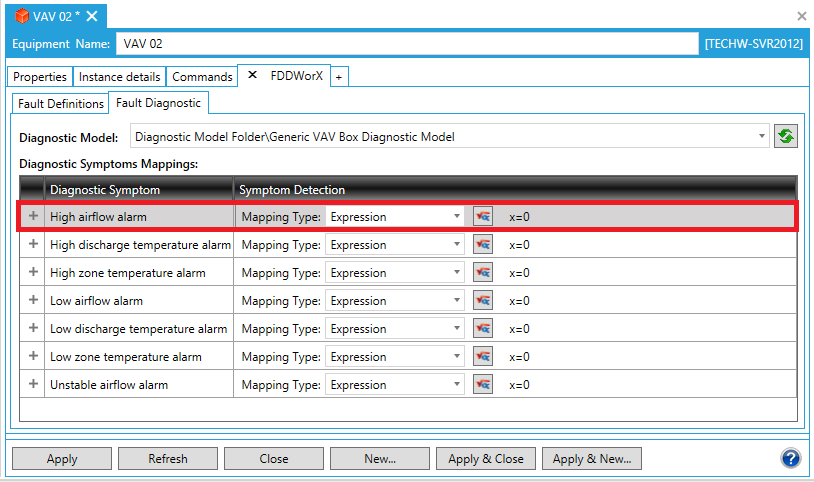
If you selected an existing diagnostic model, you'll notice that its Symptoms now populate the Diagnostic Symptoms Mappings grid within the Fault Diagnostic tab, as highlighted below. You can now set a Mapping Type, either Alarm or Expression, for each Diagnostic Symptom.
Populated Diagnostic Symptoms in the Fault Diagnostic Tab
-
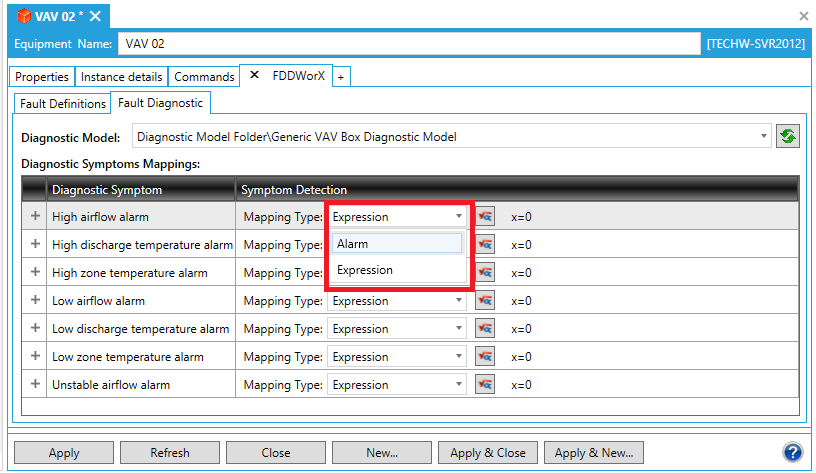
To associate Mapping Types to Diagnostic Symptoms, click on the Mapping Type pulldown menu to the right of your selected Diagnostic Symptom, as shown below. Here is where you can select from either an Alarm or Expression.
Selecting a Mapping Type
Alarm Mapping Type
-
Once you have selected Alarm as the Mapping Type, the Fault Diagnostic tab will update accordingly, as shown below.
Alarm Mapping Type Selected/Settings Updated
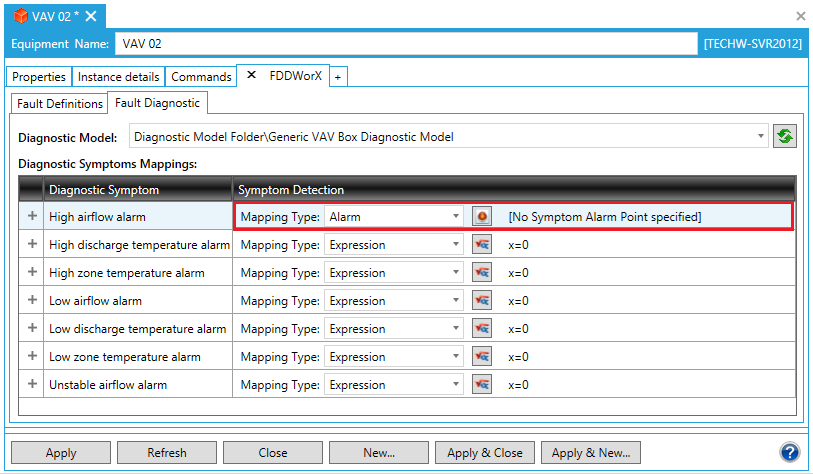
Clicking on the  button opens the Alarm
Subscription window for the selected Diagnostic Symptom, as shown below.
button opens the Alarm
Subscription window for the selected Diagnostic Symptom, as shown below.
Alarm Subscription Window
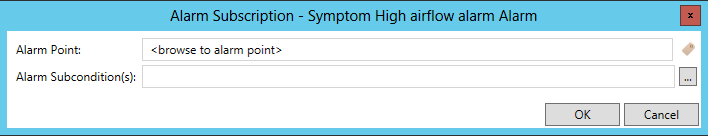
Alarm
Point - You can enter an alarm point directly into the text entry
field or click on the  button to open the Data Browser
to navigate to your selected alarm point.
button to open the Data Browser
to navigate to your selected alarm point.
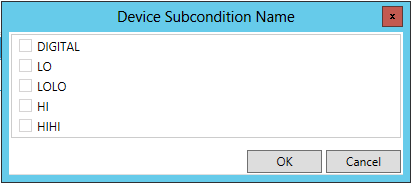
Alarm Subcondition - You can enter an alarm subcondition directly into the text entry field or click on the ellipsis button [...] to open the Device Subcondition Name window, shown below. Select from either Digital, Lo, LoLo, Hi, or HiHi. Click OK to return to the Alarm Subscription window.
Device Subcondition Name Window
Click OK to close the Alarm Subscription window.
-
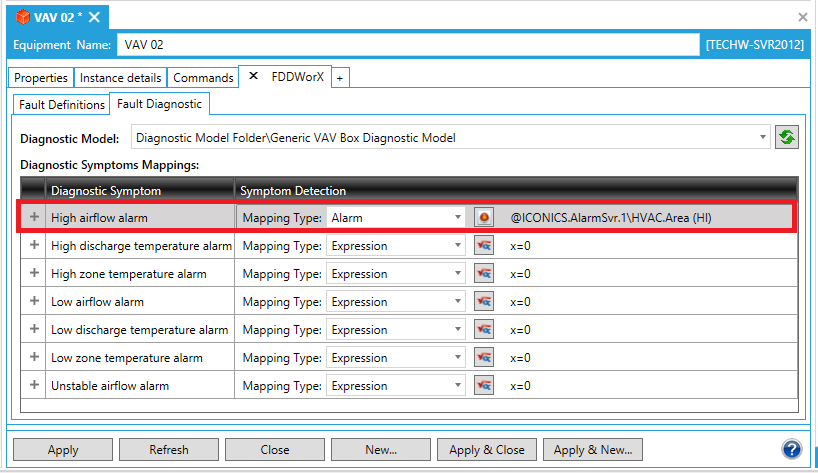
Your added Symptom Detection with Alarm Point and Alarm Subcondition will then appear in the Diagnostic Symptom Mappings, as shown below.
Newly Added Alarm Mapping Type Symptom Detection
If you are only adding Alarm Mapping Types, proceed to step 8.
Expression Mapping Type
-
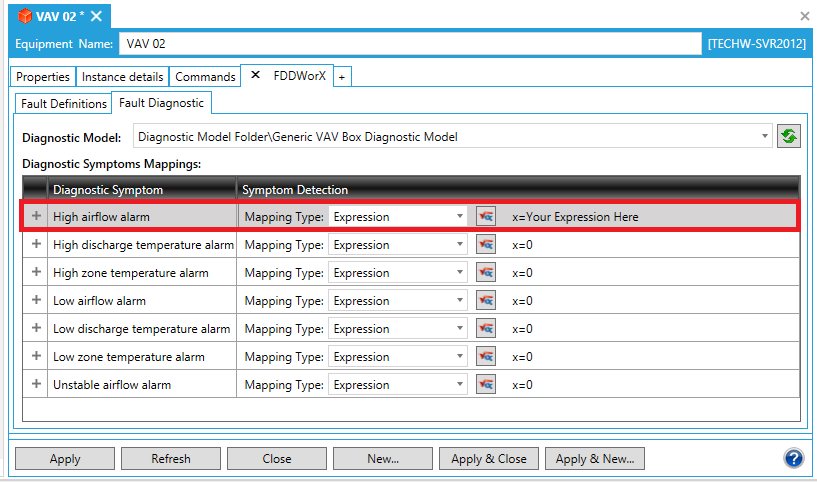
Once you have selected Expression as the Mapping Type, the Fault Diagnostic tab will update accordingly, as shown below.
Alarm Mapping Type Selected/Settings Updated
Clicking on the  button opens the Expression
window for the selected Diagnostic Symptom, as shown below.
button opens the Expression
window for the selected Diagnostic Symptom, as shown below.
Expression Window
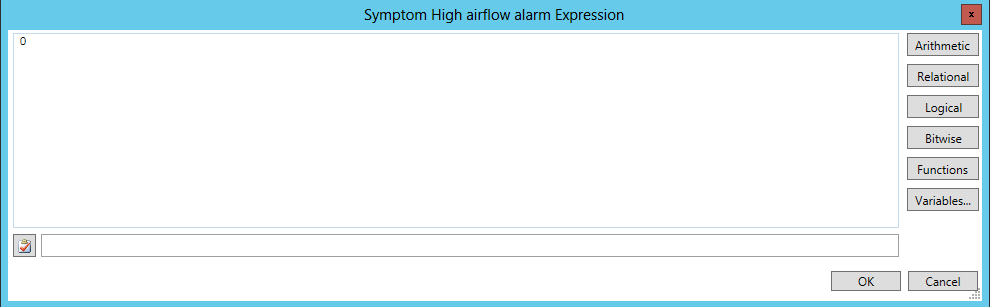
This you to use Expression
Editor options (Arithmetic, Relational, Logical, Bitwise, Functions, and
Variables). The Check Syntax button [ ] helps to make
sure you have constructed your expression correctly. Any related error/suggestions
will appear in the nearby text entry field. Clicking on the Variables
button opens the Data Browser, allowing you to search for a data source
to use within your expression.
] helps to make
sure you have constructed your expression correctly. Any related error/suggestions
will appear in the nearby text entry field. Clicking on the Variables
button opens the Data Browser, allowing you to search for a data source
to use within your expression.
Once you have completed constructing your expression, click OK to close the Expression window.
-
Your added Symptom Detection with an Expression will then appear in the Diagnostic Symptom Mappings, as shown below.
Newly Added Expression Mapping Type Symptom Detection
-
In order to save the changed status of the Fault Diagnostic Tab (with the newly completed Symptom Detection Mappings), you must then either click on the "Apply" button at the bottom of the tab window within the Project Explorer (and can then proceed to make additional changes to the same Fault Diagnostic)ORclick on "Apply & Close" to save your settings and then return to the main Project Explorer by closing the tabORclick on "Refresh" to update the Fault Diagnostic tab itselfOR click on "Reset" to return the state of the Fault Diagnostic tab to the last saved settingsORclick onApply & Newto save the current settings while creating a new fault diagnostic model/mappingsORclick onAdd New...to change the settings for an additional asset.
See Also