FDDWorX Tab for Equipment Classes
On the FDDWorX tab for equipment classes (shown below) in AssetWorX, you can configure the equipment class for ICONICS FDDWorX. This tab must be added to an equipment class node by using the + tab. For more information about adding an FDDWorX tab, refer to the + Tab for Equipment Classes topic.
|
|
Tip: An equipment node's information may be pre-configured if it was created using an equipment class. Equipment classes can contain template information, including aliases that are identified as being surrounded by /? and ?/. |
FDDWorX Tab for Equipment Classes
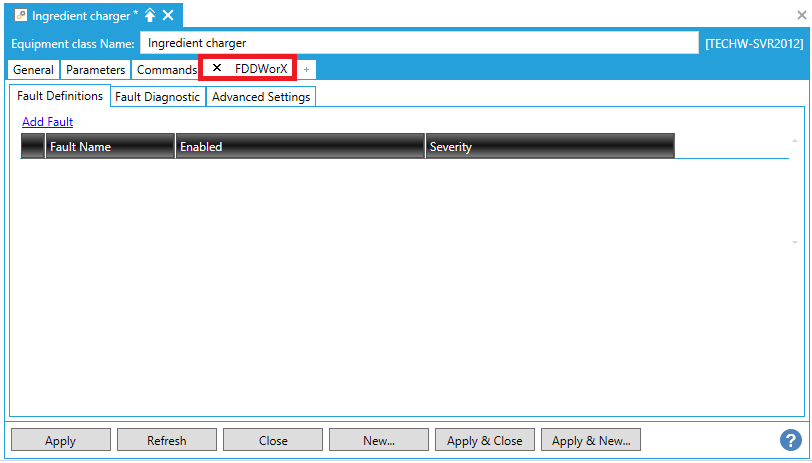
The FDDWorX tab contains three sub-tabs:
The Faults Definitions sub-tab is selected by default.
Fault Definitions Tab
Fault Definitions Sub-Tab within the FDDWorX Tab
-
Add Fault - Click this link to add a Fault to the list section of the tab. A message will appear to notify you that the newly added Fault has not yet been defined, as shown below.
Fault Added
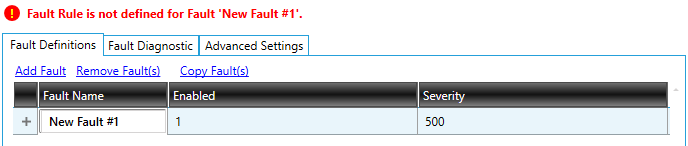
You can edit the name in the Fault Name text entry field. You can enter an expression in the Enabled text entry field or click on the  button to open the Expression Editor and create a new expression. You can also enter an expression in the Severity text entry field or click on the button to open the Expression Editor and create a new expression.
Clicking the plus sign [+] to the left of a fault allows you to change additional properties, including:
Description
Description Sub-Tab
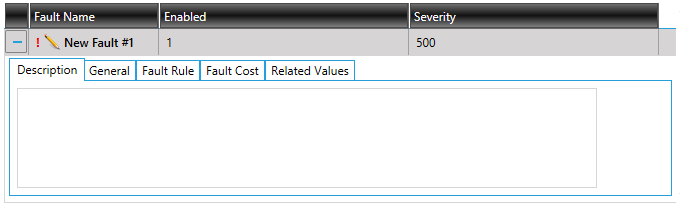
Enter a description for the selected Fault in the text entry field.
General
General Sub-Tab
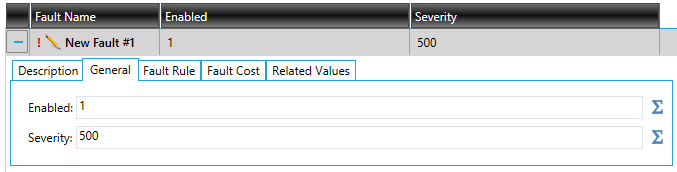
The Enabled and Severity text entry fields are the same as those that appear when you first add a fault. See the descriptions above. A change in one location replicates to the other.
Fault Rule
Fault Rule Sub-Tab
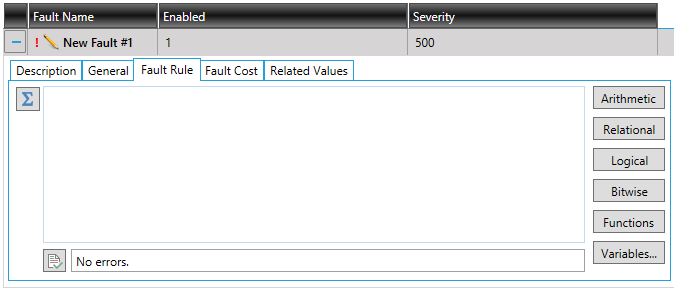
The Fault Rule sub-tab allows you to construct a fault rule to associate to your selected fault. You can enter the rule directly into the text entry field or use the buttons to the right (Arithmetic, Relational, Logical, Bitwise, Functions, Variables...) or click on the button to open the Rule Expression Editor to construct the rule. See Rules/Expression Editor for additional info. You can then click on the  button to check the syntax of the entered Fault Rule. Results will appear in the text field to the right.
Fault Cost
Fault Cost Sub-Tab
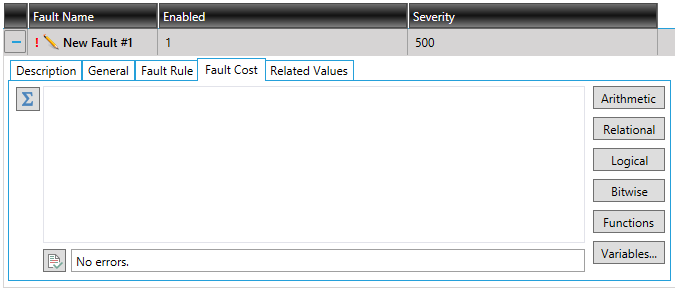
The Fault Cost sub-tab works similarly to the Fault Rule subtab. You can construct a fault cost to associate to your selected fault. You can enter the cost directly into the text entry field or use the buttons to the right (Arithmetic, Relational, Logical, Bitwise, Functions, Variables...) or click on the button to open the Cost Expression Editor to construct the cost. You can then click on the button to check the syntax of the entered Fault Cost. Results will appear in the text field to the right.
Related Values
Related Values Sub-Tab
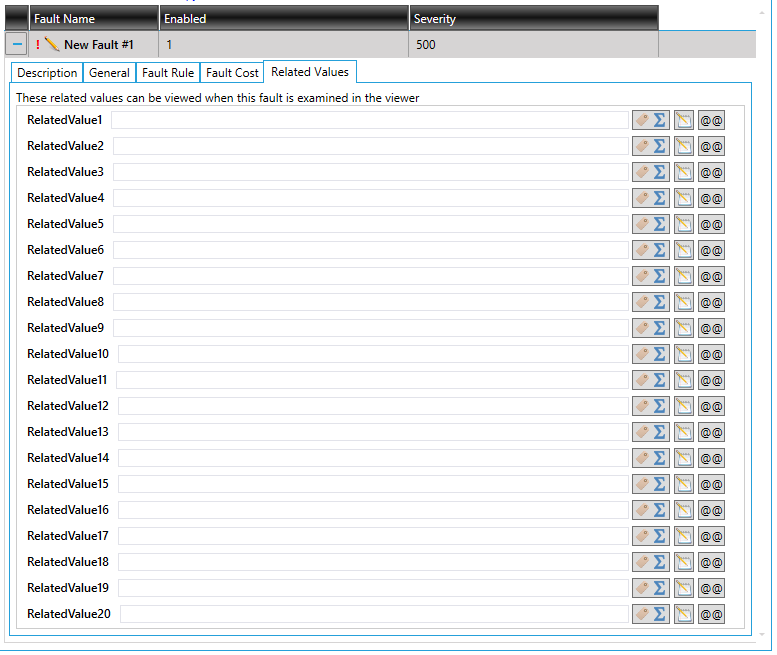
For each Related Value that you wish to create, either type in a static value in the provided text box or click on the  button to browse for a data point OR an expression (see the tabs in the top right of the Data Browser window). You can add up to 20 values that you wish to capture as part of the fault whenever the fault condition occurs. You can view these related values when you examine faults in the FDDWorX Viewer.
Clicking the  button opens the Show Details Wizard, shown below.
Show Details Wizard
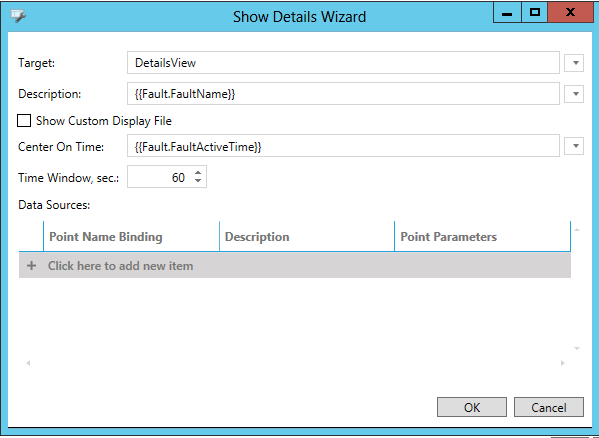
-
Target - Enter a target in the text entry field or click on the
 button to use the pulldown menu.
 -
Description - Enter a description in the text entry field or click on the
button to use the pulldown menu. -
Show Custom Display File - Click this checkbox to show a custom display file. Once checked, you will activate the Custom Display and Target Type settings.
-
Custom Display - Enter the location of the custom display or click on the
button to use the pulldown menu. -
Target Type - Use the pulldown menu to select from either Current, Popup or PopupModal.
-
Center On Time - Enter a time or or click on the
button to use the pulldown menu. -
Time Window, sec. - Enter a time window in seconds.
-
Data Sources - In this section, you can add a Point Name Binding via text entry; ellipsis button [...], which opens the Data Browser, or by clicking on the
button to use the pulldown menu. You can also enter a Description, via the text entry field within the cell, and Point Parameters, which should be filled by default but can also be edited within the text entry field.
Click OK to close the Show Details Wizard and return to the Related Values subtab.
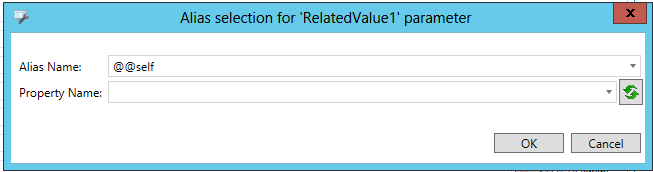
Clicking on the  button opens the Alias selection for 'RelatedValueX' parameter window, shown below. Use the Alias Name pulldown menu to select the alias, and then the Property Name pulldown menu to select the associated property. Click on the
  button to refresh the list of available properties for the selected alias. Click OK to return to the Related Values subtab.
Alias Selection Window
-
Remove Fault(s) - Once you have added at least one Fault, you can select a Fault to delete and click this link to remove it from the list.
-
Copy Fault(s) - Select a fault and click this link to copy it to the clipboard.
-
Paste Fault(s) - If you have copied any fault(s) to the clipboard, click this link to paste it/them to the list.
Fault Diagnostic Tab
Fault Diagnostic Tab
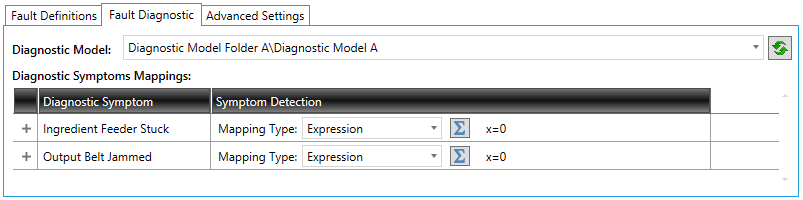
The Fault Diagnostic tab allows you to select an existing Diagnostic Model to associate to the selected fault. Use the pulldown menu to select a Diagnostic Model. Click on the  button to refresh the list to show any recently added diagnostic models.
By selecting a Diagnostic Model, you will see the bottom of the tab populated with the Diagnostic Symptoms Mappings, including the Diagnostic Symptom and Symptom Detection.
You can click the plus [+] button to the left of any Diagnostic Symptom to edit its Mapping Type; either Expression or Alarm.
Expression
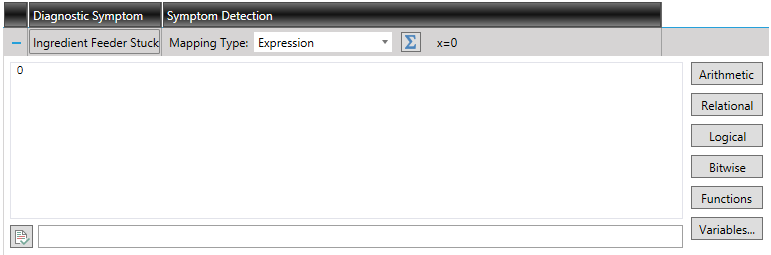
If you are editing an Expression Mapping Type (via either the [+] or buttons), you will see an Expression Editor where you can edit/construct an expression. You can then click on the button to check the syntax of the entered expression. Results will appear in the text field to the right. Once you have made your settings, the expression will appear in the Diagnostic Symptoms Mappings section to the right of the button.
Expression Mapping Type Selected
Alarm
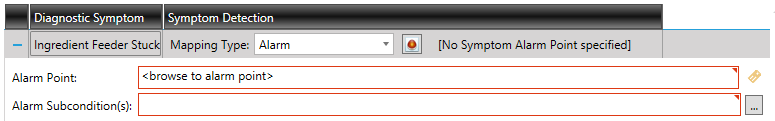
If you are editing an Alarm Mapping Type (via either the [+] or  button), you will see the following settings:
-
Alarm Point - Enter an alarm point in the text entry field or click on the
 button to open the data browser to navigate to your selected alarm.
 -
Alarm Subconditions - Enter alarm subconditions in the text entry field or click on the ellipsis button [...] to open the Device Subcondition Name window to select them.
Once you have finished, your alarm settings will appear in the Diagnostic Symptoms Mappings section to the right of the button.
Alarm Mapping Type Selected
Advanced Settings Tab
Advanced Settings Tab
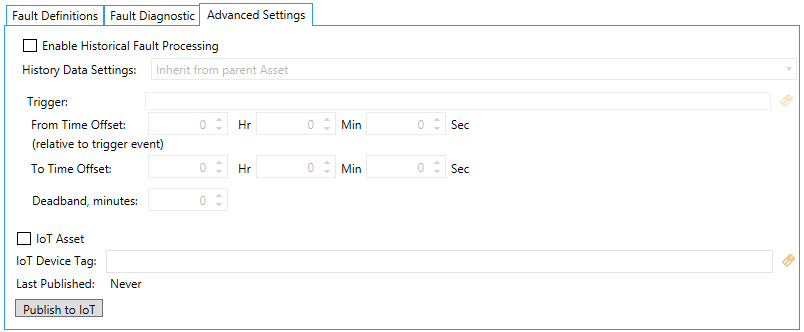
-
Enable Historical Fault Processing - Click this checkbox to turn on Historical Fault Processing, flagging the selected FDD-enabled asset as Historical rather than Real-time. All faults of the Historical Asset will then be processed as Historical Faults.
-
History Data Settings - Use the pulldown menu to select from either "Inherit from parent Asset" or "This specific settings". For "Inherit from parent Asset", there should be a configured historically-enabled asset in the ancestor tree which should have a 'specific settings' historical mode. The same settings would be applied to the historical processing of the current asset and those of its children, having inherited historical mode, as well. When "This specific settings" is selected, it enabled the remaining settings.
-
Trigger - Enter a trigger in the text entry field or click on the
button to open the Data Browser and navigate to your selected trigger. -
From Time Offset (relative to trigger event) - Enter the hours, minutes and seconds in the respective text entry fields, or use the up/down arrows.
-
To Time Offset - Enter the hours, minutes and seconds in the respective text entry fields, or use the up/down arrows.
-
Deadband, minutes - Enter a time in the text entry field for deadband, in minutes.
-
IoT Asset - Alternatively to making the FDD-enabled asset a Historical asset, you can click this checkbox to classify it as an Internet of Things (IoT) asset. Selectin this option will enable the remaining settings.
-
IoT Device Tag - Enter an IoT Device Tag in the text entry field or click on the
button to open the Data Browser and navigate to your selected IoT Device Tag. -
Last Published - This entry will autofill with the date the selected IoT Asset was last published.
-
Publish to IoT - Click this button to publish the FDD-enabled asset (now classified as an IoT Asset) via the GENESIS64/AnalytiX IoT settings.
See Also: